Map of the Mediterranean from the Catalan Atlas of 1375. Lingua Franca was the medieval language used by Mediterranean traders for more than 8 centuries.
“The future is already here – it's just not evenly distributed.”
The Economist, 2003 - William Gibson
Many successful paradigms in engineering and computer science are the result of two distinct approaches colliding with each other, leading to broader and more powerful applications.
If you take AI as an example, the democratization of self-driving cars directly benefited from the progress in deep learning combined with computer vision. Similarly, the combination of reinforcement learning and robotics has led to progress in autonomous control systems for robots. Another recent example is the combination of machine learning and natural language processing, which has led to the advent of conversational chatbots that can understand and respond to user queries in a more natural and human-like manner.
In the following blog post, we’ll look at the parallel backgrounds of two established paradigms: SQL and Observability. We’ll explain how they have collided and together create a new array of opportunities in the field of Observability. Lastly, we provide the necessary elements for the reader to answer the question: is SQL-based Observability applicable to my use case?
If you don’t have time to read the whole post (~10 mins), you’ll find the main takeaways in the summary section.
Lingua Franca
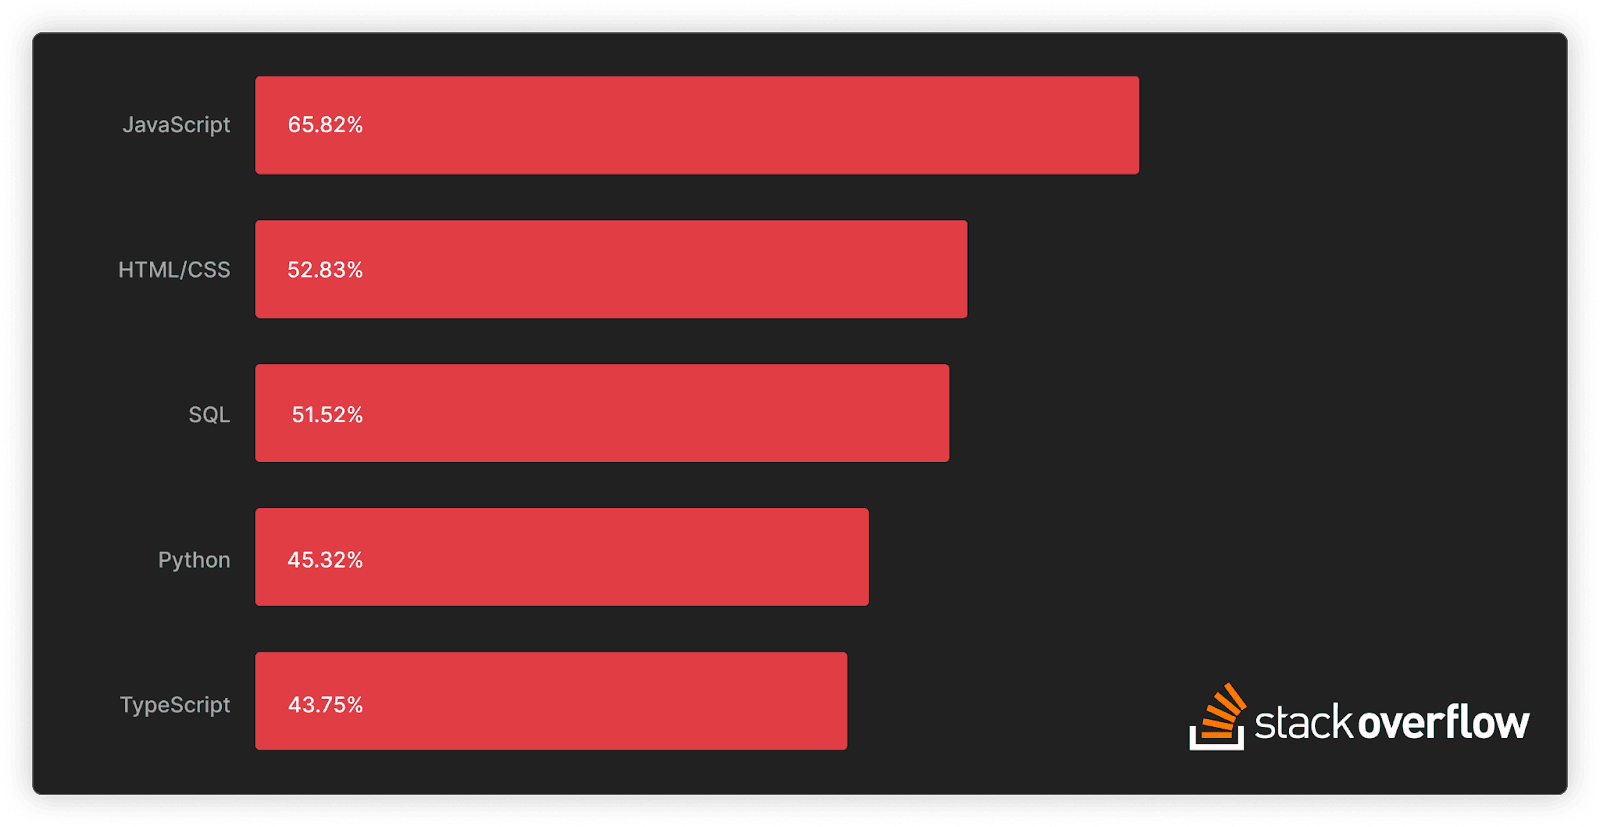
Next year will mark the 50th anniversary of SQL (Structured Query Language). If your job or hobbies are related to technology, data, or software, then there is a significant probability that you’ve dealt with SQL before. The 2023 StackOverflow Developer Survey ranked SQL as the 3rd most popular programming language, used by more than half of the 67k professional developers surveyed (some might say it’s not a real programming language, or is it?). We must also note that, by design, these numbers are biased towards software developers and only partially include analysts or data engineers/scientists who are also SQL aficionados.
In this fast-paced digital age, SQL’s longevity and popularity are an exception and a testament to its elegant simplicity and adaptability
What is also interesting about the top 5 programming languages presented above, is that apart from SQL, all the other languages cited were created in the 1990s or later, with an average age of ~25 years. In this fast-paced digital age, SQL’s longevity and popularity are an exception and a testament to its elegant simplicity and adaptability.
It was not all smooth sailing for half a century, though, as many languages appeared over the years and claimed superiority when it came to handling data. Many remember the NoSQL era, where access to affordable compute and storage enabled the NoSQL movement to disrupt the long-standing reign of SQL. More than a decade later, however, the data landscape mostly returned to SQL, as another acknowledgment of its enduring strengths.
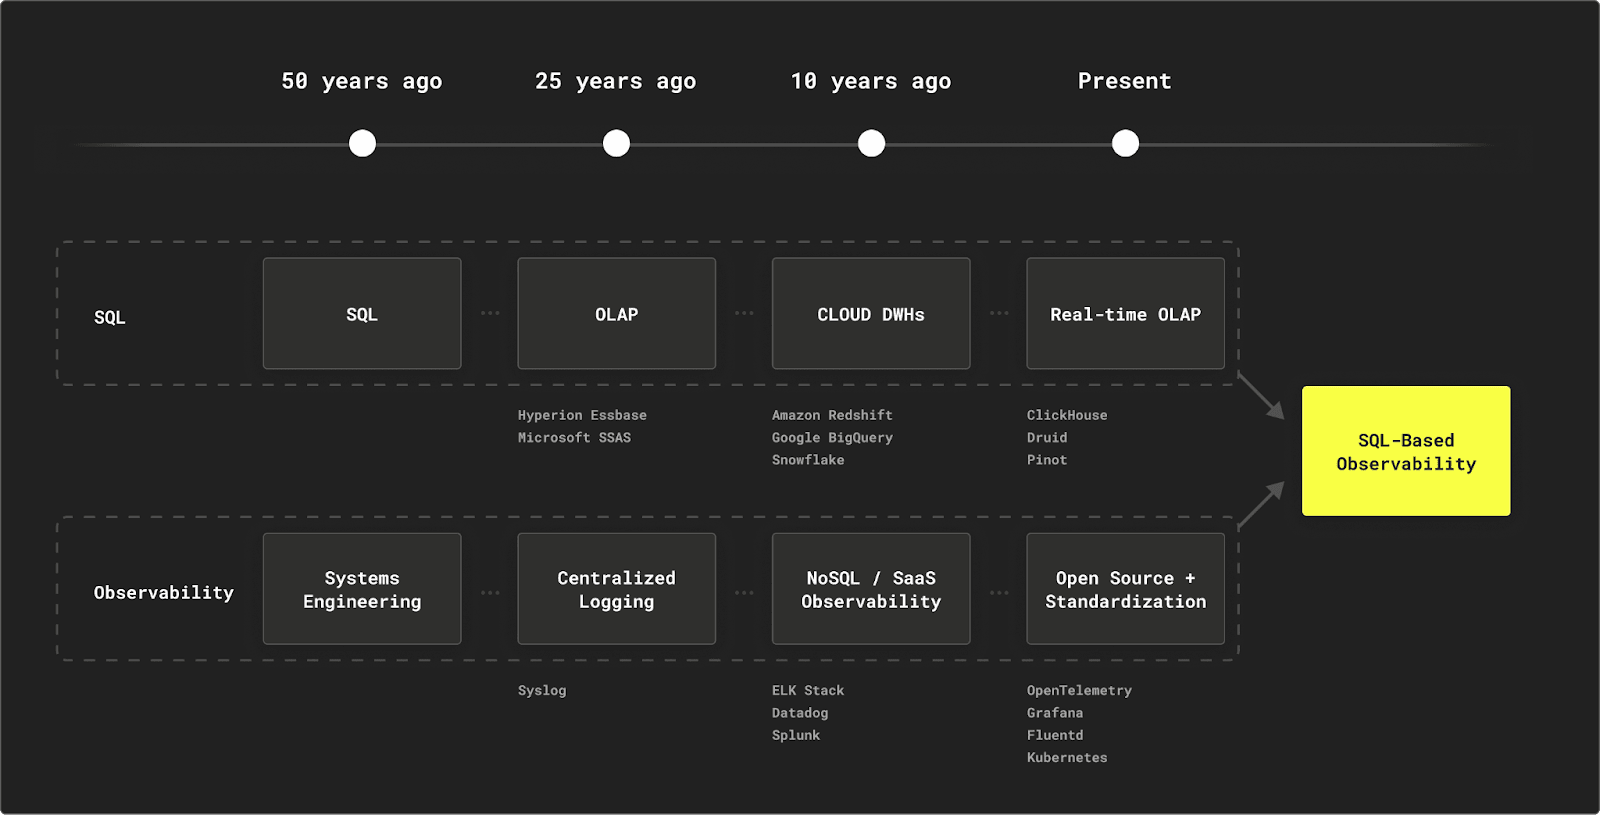
The democratization of OLAP and the advent of real-time analytics
SQL was modeled and adapted for different applications over the years, roughly grouped into two categories: OLTP and OLAP (Online Transaction Processing and Online Analytical Processing). The OLTP databases saw a broad adoption almost from day zero with proprietary systems like IBM Db2 and Oracle, then with open-source counterparts like MySQL and Postgres. This was driven by the fact that these systems play a key role as the backend and source of truth of virtually any application.
Interestingly, the OLAP term was first introduced by E. F. Codd almost exactly 30 years ago (even if OLAP-like systems existed earlier). The adoption story for OLAP was different from the OLTP one since analytics systems were not always seen as a "must-have" and, depending on the size of the datasets and the nature of the business requirements, some moderate analytics requirements can be fulfilled with OLTP systems. This meant that initially, OLAP systems were adopted only by large organizations that were able to justify the investments in proprietary solutions like Essbase or Microsoft SSAS initially or SAP Hana and Vertica more recently.
More than a decade ago, one significant catalyst for the OLAP's widespread adoption was the rise of cloud-based data warehouses, led by the trifecta: Snowflake, Google BigQuery, and Amazon Redshift. On the open-source front, alternatives started to emerge with Apache Druid (2011), Apache Pinot (2013), and ClickHouse (started in 2009, open-sourced in 2016). The advent of open-source OLAP databases has contributed to lowering entry barriers, offering cost-effective alternatives, and allowing organizations to tailor solutions to their specific needs around real-time analytics. We detailed in a previous post how open-source OLAP systems are effectively enabling the real-time data warehouse.
Since observability is a real-time analytics-oriented task, in this blog post, we will use the acronym SQL interchangeably to refer to the query language itself as well as its application in the OLAP use case.
From dynamic systems to syslog and ... Twitter
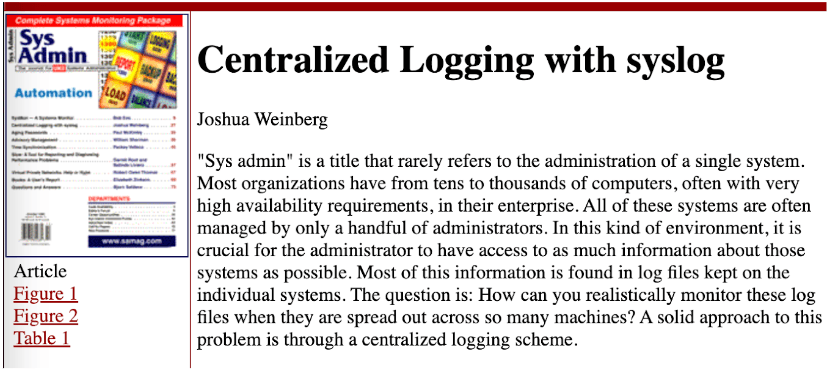
Surprisingly, the observability roots are even older than SQL. The engineer Rudolf E. Kálmán was the first to use the term in the 1960s as a measure of how well the internal states of a system can be inferred from knowledge of its external outputs. The advent of computers and IT systems then led to a proliferation of monitoring and logging approaches. What I consider another major milestone happened in the 1980s with the advent of "syslog", developed by Eric Allman as part of the Sendmail project. In 1998, Joshua Weinberg described how to use syslog to centralize logs from heterogeneous systems to help system administrators in their daily tasks with the help of a couple of Perl scripts. Thus, the idea of centralized logging was born, which would later become the first pillar of Observability. It’s worth noting that this initial approach was more focused on the mechanics of shipping logs in IT networks and didn’t address the question of storage, treating logs as plain files.
Fast forward to 2013, when Twitter’s rapid growth was leading to unprecedented scalability challenges. This forced its engineering team to move fast, shifting away from a monolithic architecture to massively distributed systems, all while keeping the service up and running. Twitter captured their approach back then in the influential blog post "Observability at Twitter":
“It is the Observability team’s mission to analyze such problems with our unified platform for collecting, storing, and presenting metrics … As Twitter continues to grow, it is becoming more complex and services are becoming more numerous. Thousands of service instances with millions of data points require high-performance visualizations and automation for intelligently surfacing interesting or anomalous signals to the user”.
As a technology-focused company and because no turn-key Observability solution was available, Twitter engineers built most of the components to power these requirements in-house, including a custom time-series database built on top of Apache Cassandra, a leading NoSQL store. In parallel, in countless other organizations, people also noticed that full-text search engines like Elasticsearch can also be used for storing logs and telemetry data. This approach, fueled by the advent of the ELK stack, or proprietary solutions like Splunk, propelled other NoSQL stores as de facto observability stores.
Since then, the world has caught-up, and every organization is more technology-focused than ever. So, naturally, many tools and vendors have emerged in the observability space to provide out-of-the-box, on-prem, or SaaS solutions, so that companies don’t have to build their own, as Twitter did back in 2013. The resulting Observability landscape consisted of a mix of NoSQL stores and turn-key SaaS solutions that often use NoSQL stores as backends. This also led to the "stretching" of the observability term definition to encompass a set of tooling and practices that enable organizations to monitor and operate their assets effectively.
Colliding paths: Observability is just another data problem
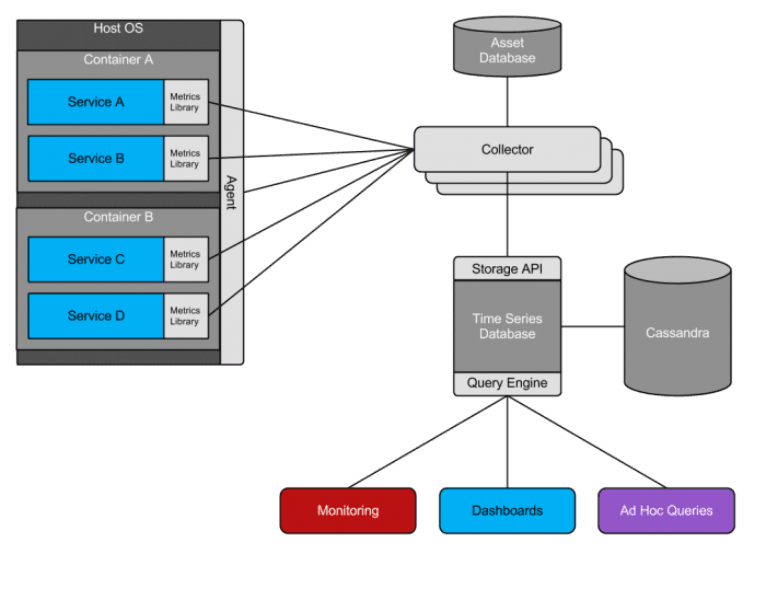
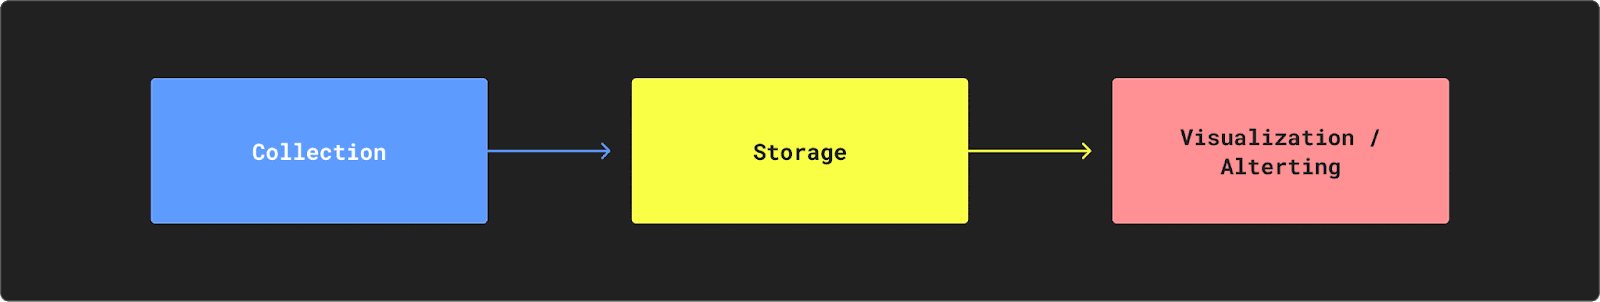
The 2013 Twitter post (cited above) already set the standard observability pipeline, which consists of collection, storage, visualization, and alerting (note that Twitter referred to alerting as "monitoring").
So what has changed in 10 years?
The structure of this pipeline is still pretty much the same; many observability vendors provide all the components for the end-to-end experience, from collection agents, and data aggregators to the storage layer and presentation GUIs. However, in each step of the observability pipeline, new ideas and projects emerged to offer alternative solutions that effectively bring SQL back into the observability game. So, let’s dive into each step.
In each step of the observability pipeline, new ideas and projects emerged to offer alternative solutions that effectively bring SQL back into the observability game
Collection
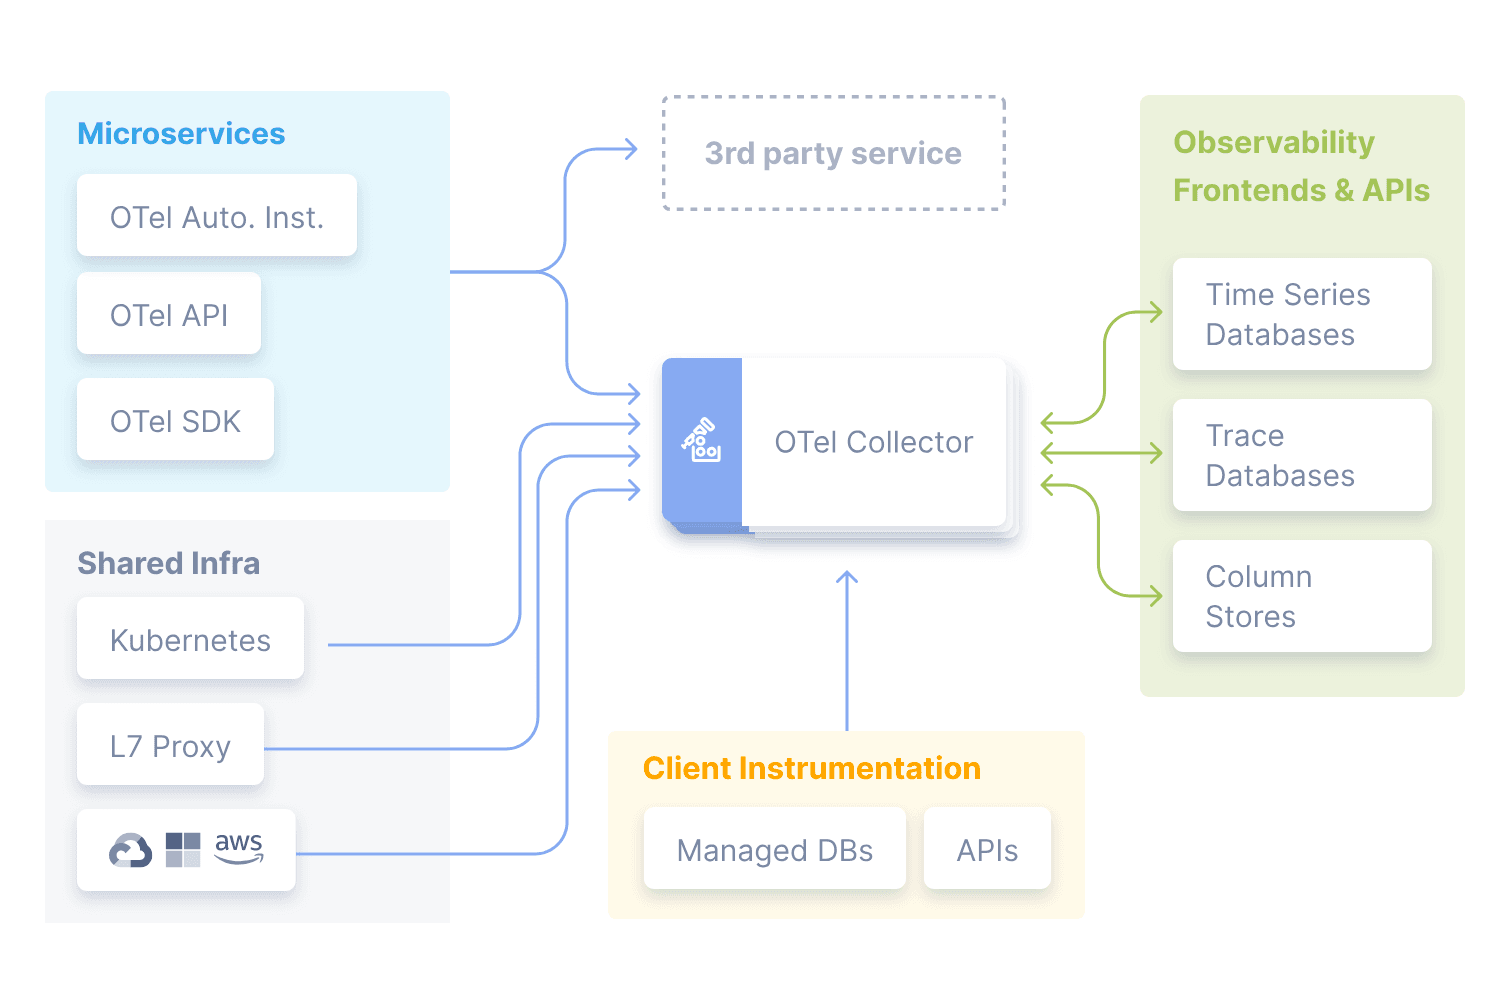
Open-source did its magic in this data collection step, where projects like OpenTelemetry (OTel for short) were created by the community to address observability collection specifically. OpenTelemtry is a CNCF incubating project that provides a set of vendor-neutral APIs, SDKs, and tools for instrumenting, generating, collecting, and exporting telemetry data such as traces, metrics, and logs. Importantly, OTel is slowly but surely establishing itself as an industry standard. This standardization makes it significantly easier to integrate with different storage layers and frontends and break free from locked-in environments.
Storage
The storage layer is the engine of the observability stack and requires systems that can ingest and expose ever-growing volumes of data in real-time. As an OLAP column store, ClickHouse is suitable for virtually any volume of data and possesses characteristics that make it particularly suitable for observability data.
“Real-time” Speed
ClickHouse operates at the millisecond scale and uses all available system resources to their full potential to process each analytical query as fast as possible. This is also true for ingestion speeds, where reaching millions of rows per second is not uncommon. This is made possible due to a combination of the columnar structure of data on disk and attention to the low-level implementation (e.g. vectorized query engine) required to implement the fastest OLAP database.
Compression
Grouping similar data in columns is not only beneficial for analytics queries but also allows the maximization of the compression ratios of the homogeneous column files, benefiting from the locality effects of ordering. In contrast, one of the main challenges of the NoSQL index-based stores is the inflated footprint of the data on disk.
ClickHouse ships with compression algorithms that can process data on the fly at ingest and query times. This is particularly impactful for observability data where a significant level of redundancy is expected. For example, in a recent study, we found that the 14x compression ratio obtained on logging data managed by ClickHouse still enabled us to achieve great performance on a minimal hardware footprint.
Bottomless storage
ClickHouse can be deployed on a shared-nothing architecture (with each node managing its own storage and compute). This works for many use cases but has the drawback of introducing a rigid scalability model and some fragility, as disks tend to be expensive and unreliable.
Another shift in data stores happened with the notion of "separation of storage and compute". It's often more appealing to deploy a "shared storage" approach backing ClickHouse nodes by object storage instead of disk. ClickHouse Cloud takes it a step further, implementing full separation of storage and compute in a "shared everything" architecture. The S3-backed architecture also simplifies data management: there is no need to size the cluster/storage upfront or even shard the data.
This sacrifices a portion of the query performance in favor of reduced operational complexity (if you compare SSD NVMe to S3-backed systems, for example). However, our tests at the Clickhouse Cloud scale show that the benefits are far greater, which makes it appealing to observability workloads with ever-growing data loads.
Interoperability
With 99 data formats supported, 20+ built-in integration engines, and hundreds of 3rd party integrations part of a broader, vibrant open-source integrations ecosystem, interoperability is not an afterthought but a main characteristic of ClickHouse. This allows it to integrate easily into virtually any existing stack and reduce the complexity and deployment times. It also means that the data is never locked into the platform and can be easily replicated, moved around, or simply queried in place by different means.
For example, you can decide to store large volumes of telemetry data in Parquet format in a remote object storage bucket for archival purposes using the S3 table functions, effectively expanding your retention capabilities e.g. for compliance adherence, while still being able to query data remotely.
Unparalleled Expressivity
ClickHouse SQL supports more than 1474 aggregation and analytical functions that make real-time data exploration simple and powerful. Features like Materialized Views are often leveraged to transform data at insert time, which supports common tasks like extracting structure from unstructured logs, combined with partitioning, TTL management, dynamic column selection, materialized columns, and more. Server-side data transformations powered by tools like dbt (Data Build Tool), also make ClickHouse a powerful data store to streamline and organize data transformation workflows.
Additionally, efficient approximations for quantiles, uniq, sampling, LTTB, and many more are game-changers for blazing-fast queries over large spans of data.
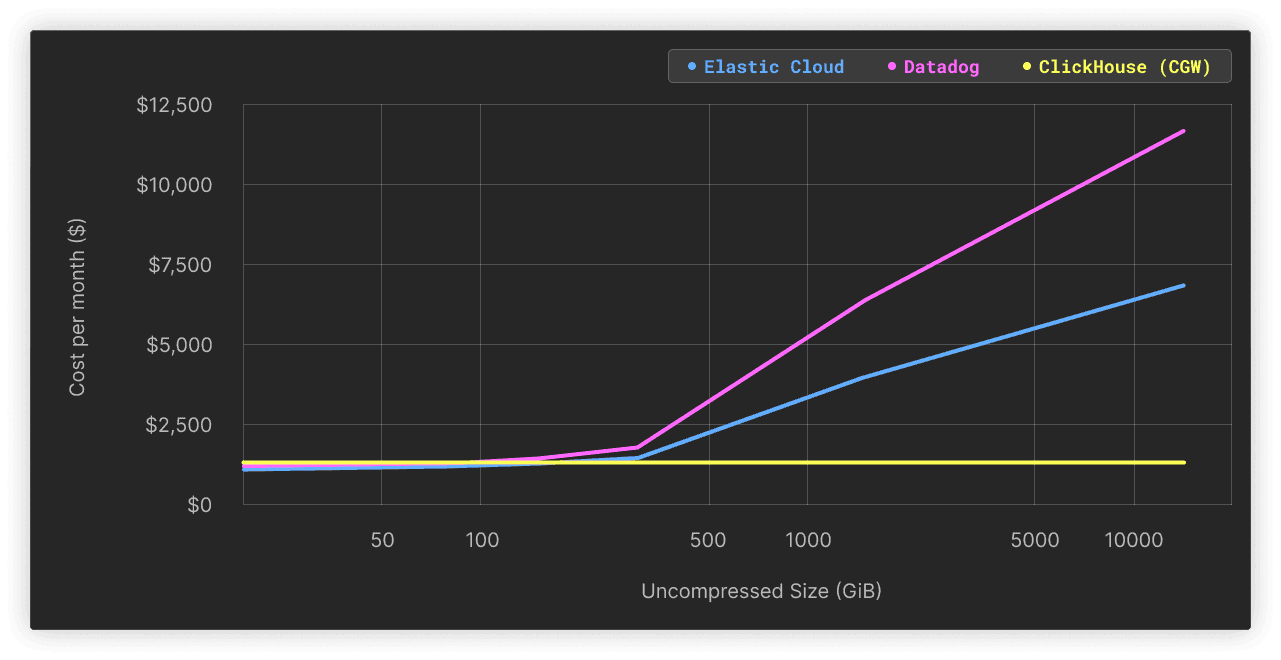
TCO (Total Cost of Ownership)
The combination of the factors cited above results in an overall lower TCO for ClickHouse-based platforms while unlocking the full potential of the data. We recently ran an experiment on a minimal ClickHouse Cloud setup that showed that you can achieve great performance for up to 14TiB of logs for as little as $300 a month. This comparison gets more interesting the more data you add, with it clearly showing that the cost and volume tend to grow at varying speeds depending on the platforms.
Visualization and altering
The presentation layer for data can take various shapes. In that space, ClickHouse benefits from a vibrant ecosystem of integrations.
As a leading provider of visualization capabilities for observability, we work closely with Grafana Labs on the clickhouse-datasource to make sure the user experience is smooth and leverages all relevant ClickHouse capabilities. Grafana also provides built-in alerting capabilities and an extensive catalog of connectors to combine various data sources in the same dashboards.
Some of our users also found success in leveraging alternative open-source visualization and BI tools for logging, like Metabase, while others built custom ones. This demonstrates that an open ecosystem allows for innovative applications to thrive.
Another important aspect of exposing the observability data in a SQL database like ClickHouse is that virtually any SQL-compatible client can interact with it via the supported interfaces (Native, HTTP, ODBC, JDBC, MySQL). From SQL Clients to data visualization and BI tools and language clients. This expands the set of possibilities to implement custom alternatives to locked-in experiences.
Finally, even if the learning curve for SQL is often short, the democratization of Generative AI applied to code generation makes it easier than ever to simply generate SQL queries from natural language inputs instead of writing queries. This renders the SQL learning curve argument less relevant. Users of ClickHouse Cloud can already write queries as natural language questions and leave it to the console to convert these to SQL queries based on the context of the available tables. The same approach is used to fix user queries on the fly automatically.
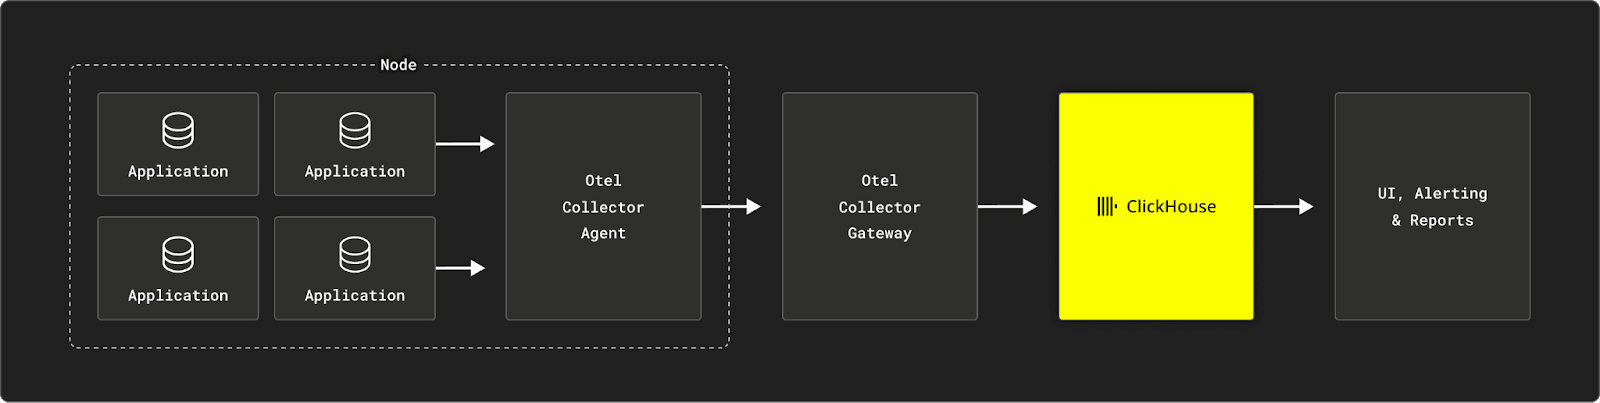
The SQL-based Observability Pipeline
The SQL and observability parallel timelines we discussed earlier show that when it comes to technology, the path from inception to global adoption and democratization can take various forms.
We believe that, at present, the accessibility of efficient real-time OLAP stores combined with the maturity of the open-source observability standards allow for applying the proven and time-tested SQL principles to the Observability use case. Furthermore, treating observability as another data use case leads to its commoditization, accelerating its global adoption.
The resulting SQL-based observability stack is simple and unopinionated, leaving many options for the users to personalize, adapt, and integrate within an existing IT environment. For example, some architectures will leverage a message queue (like Apache Kafka) to help collect and buffer the data before ingesting it in ClickHouse (we displayed such an architecture in our recent example with WarpStream). Other examples might deploy more than one visualization tool to offer self-service visualization capabilities in addition to classic dashboarding.
We recently estimated the cost savings ratio of LogHouse vs. a leading commercial SaaS observability provider to be a factor of 300
We deployed the stack above at ClickHouse as the centralized logging platform for ClickHouse Cloud code-named "LogHouse"." It is a multi-region ClickHouse Cloud deployment that leverages the OpenTelemetry Kubernetes integration for collection, ClickHouse Cloud for storage, and Grafana for dashboarding and log exploration. It currently manages more than 10 Petabytes of telemetry data compressed down to just 600 Terabytes in Clickhouse (an x16 compression ratio!) and successfully serves our logging requirements for all the services we manage. We recently estimated the cost savings ratio of LogHouse vs. a leading commercial SaaS observability provider to be a factor of 300.
Similarly, many users running large-scale use cases have already successfully implemented SQL-based observability pipelines. Examples include:
- OLAP for Monitoring with ClickHouse on Kubernetes, at eBay
- HTTP Analytics for 6M requests per second using ClickHouse, at Cloudflare
- A cost-effective logging platform using Clickhouse for petabyte scale, at Zomato
- Fast and Reliable Schema-Agnostic Log Analytics Platform, at Uber
- ClickHouse for Observability, at Gitlab
- LLM Monitoring, at Helicone
- ClickHouse for OpenTelemetry Traces, at Resmo
ClickHouse is also used as a backend for some of the most popular Observability SaaS providers including:
OK, now what’s the catch?
While there are the advantages listed in detail in the previous section, the user embarking on the SQL-based observability journey must be aware of the current limitations to make an informed decision (as of December 2023).
Observability is traditionally organized into three pillars: Logging, Metrics, and Traces. Based on our experience running ClickHouse for observability at scale for ourselves and with customers, we believe that at the current level of maturity of the ecosystem, Logging and Traces are the two pillars that are the most straightforward to address. We documented these use cases extensively in two previous posts: logs and traces.
The Metrics use-case, on the other hand, is currently dominated by Prometheus as both a dimensional data model and query language. While we see many use cases leveraging ClickHouse successfully for metrics, we believe that a turn-key metrics experience would benefit from PromQL support in ClickHouse. Thus, we have decided to invest in this area.
Finally, the user considering SQL-based observability needs to take into account the adoption question by considering the internal teams/user's skills and profiles. Even if SQL is the lingua franca of data manipulation and can be easily generated with AI assistance, observability users may come from different backgrounds (SREs, analysts, DevOps, or administrators), and depending on the type of experience you want to create for them (aka self-service vs. pre-prepared dashboards and alerts), the learning-curve for SQL might or not make sense and will have to be evaluated.
Is SQL-based Observability applicable to my use case?
Here is a summary list of what you need to know if you want to consider SQL-based observability for your use case (I promise it was not generated by asking ChatGPT to summarize this post):
SQL-based observability is for you if:
- You or your team(s) are familiar with SQL (or want to learn it)
- You prefer adhering to open standards like OpenTelemetry to avoid lock-in and achieve extensibility.
- You are willing to run an ecosystem fueled by open-source innovation from collection to storage and visualization.
- You envision some growth to medium or large volumes of observability data under management (or even very large volumes)
- You want to be in control of the TCO (total cost of ownership) and avoid spiraling observability costs.
- You can’t or don’t want to get stuck with small data retention periods for your observability data just to manage the costs.
SQL-based observability may not be for you if:
- Learning (or generating!) SQL is not appealing to you or your team(s).
- You are looking for a packaged, end-to-end observability experience.
- Your observability data volumes are too small to make any significant difference (e.g. <150 GiB) and are not forecasted to grow.
- Your use case is metrics-heavy and needs PromQL. In that case, you can still use ClickHouse for logs and tracing beside Prometheus for metrics, unifying it at the presentation layer with Grafana.
- You prefer to wait for the ecosystem to mature more and SQL-based observability to get more turnkey.
Closing remarks and perspectives
With this post, we do our best to propose an honest assessment of the state of SQL-based observability. This is based on our knowledge of the use case, the trends we see every day in the field, and our own experience running observability pipelines. We hope that these elements will help you decide for yourself and make an informed decision on whether SQL-based observability is appropriate for you.
Also, this represents the state of this field at the time of writing (December 2023). This space is continuously improving and expanding at a high pace, challenging some of the core requirements we discussed above. For example, ClickHouse's recent support for inverted indexes is now more relevant for log exploration and search. Language support is also quickly evolving with the recent addition of Kusto Query Language (KQL) to ClickHouse, a pipe-oriented query language particularly suitable for the analysis of telemetry data and popular within the security analytics community. Finally, as discussed above, the generative AI leap applied to code generation allows for lowering the barrier to entry by simply interacting with the observability data in plain English (or your preferred language).
Hopefully, these enhancements, plus the open-source stack maturity, will compound to expedite the commoditization of observability, contributing to its broader adoption in organizations and benefiting virtually everyone with more reliable end solutions.