Introduction
At ClickHouse, we appreciate open-source communities and the value they contribute to innovation. With an industry focus on machine learning, and more recently on Large Language Models (LLMs), Hugging Face has become a vital community in driving innovation and collaboration within this space. Hugging Face provides a platform where the machine learning community can collaborate on models, datasets, and applications.
In previous blog posts, we have explored clickhouse-local – a version of ClickHouse designed and optimized for data analysis using the local compute resources on your laptop or workstation. This tool is great for anyone who wishes to perform a data analysis task on files using SQL, with it offering the same query capabilities as a server installation but available as a single executable binary. The datasets offered by Hugging Face, and contributed by the community, offer interesting opportunities for analysis and we can perform this analysis using the clickhouse-local tool.
In this blog post, we show how easy it is to analyze a Hugging Face hosted dataset using just SQL. As part of this, we perform some simple queries on a Spotify track dataset, before exploring some of ClickHouse’s more interesting statistical functions. Finally, we create a simple reusable UDF to query any Hugging Face dataset by only its name.
Hugging Face API
Hugging Face’s commitment to providing well documented and consistent APIs has been fundamental in its adoption and its position as the de facto means of sharing models and datasets. The Datasets Server offers a web API for visualizing and exploring all types of datasets - computer vision, speech, text, and tabular.
As well as exposing a REST API allowing simple integration with clickhouse-local, all datasets are also automatically converted to Parquet when uploaded. This format is natively supported in ClickHouse as a first-class citizen, with a continued effort to improve read and write performance.
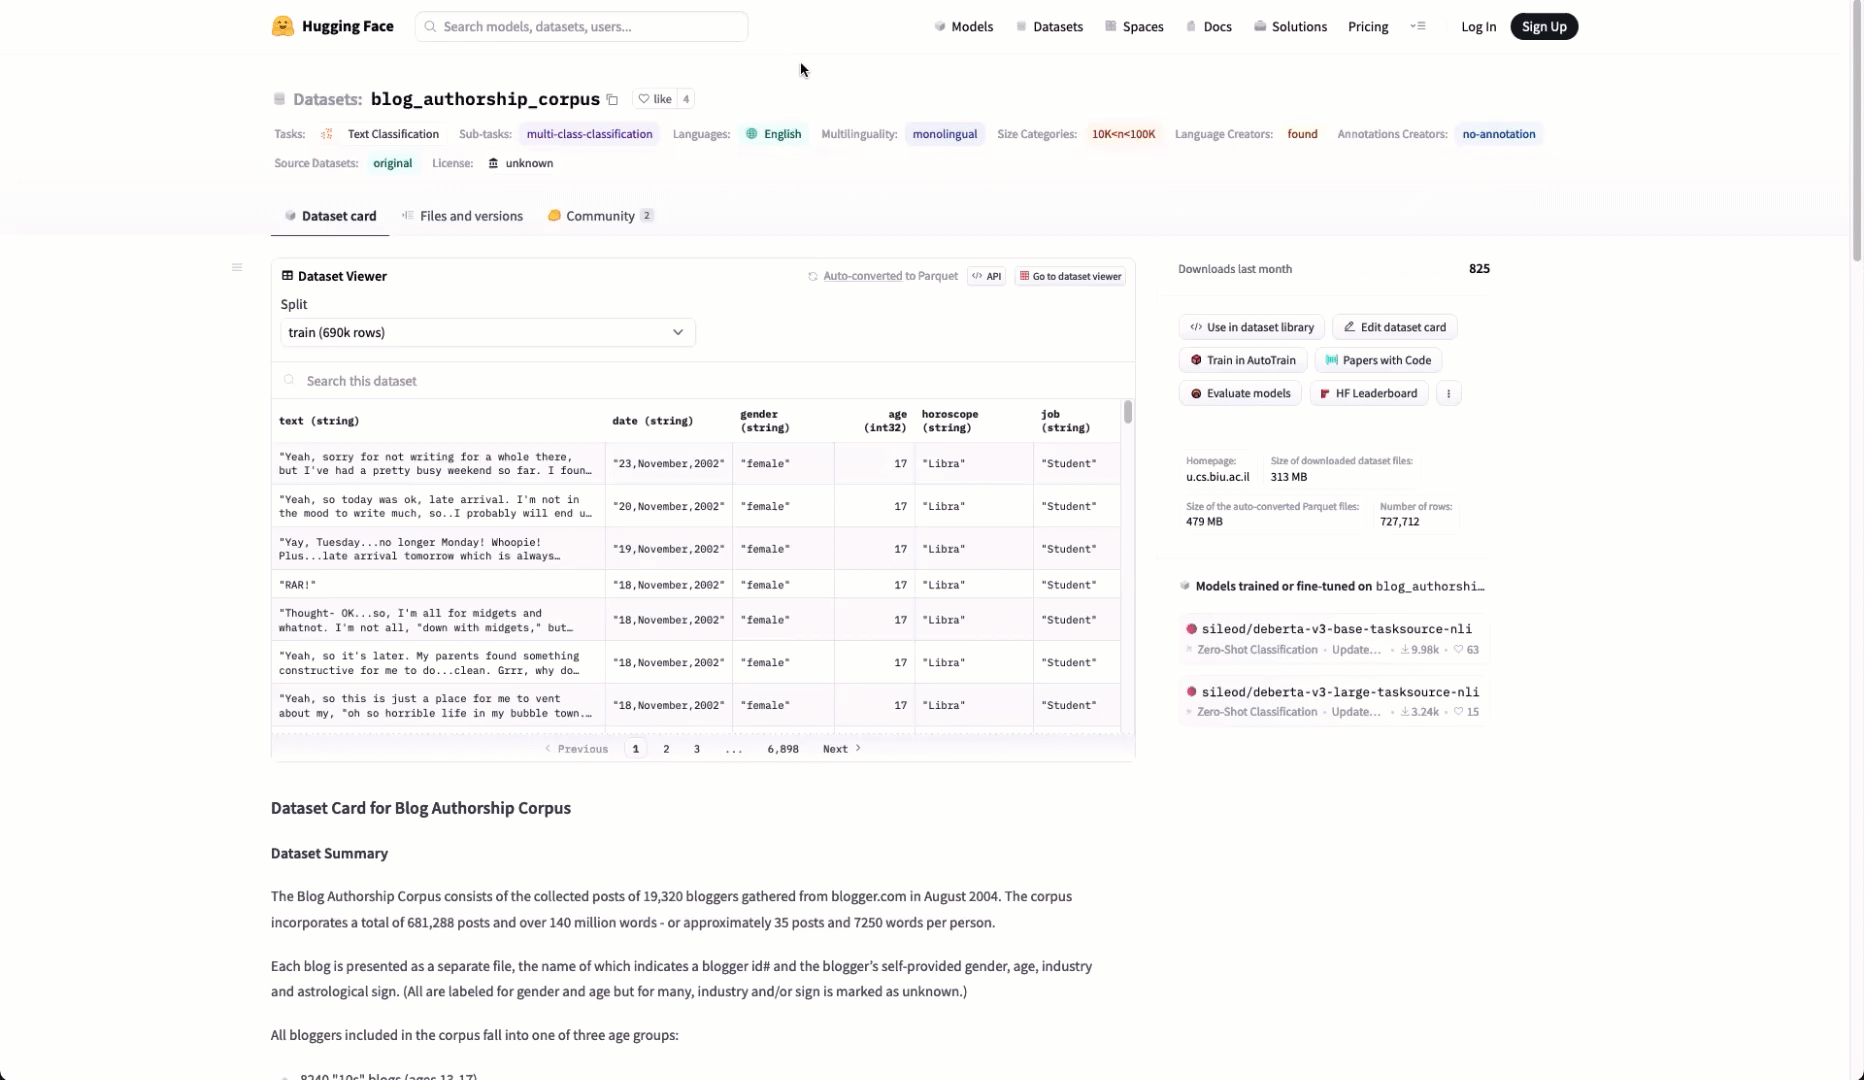
Users visiting a datasets page on Hugging Face can view the available Parquet files using the "Auto-converted to Parquet" button at the top of the page.
This listing is powered by the REST API noted above. To obtain the list of Parquet files for any dataset, we can simply use the following endpoint.
https://datasets-server.huggingface.co/parquet?dataset=<dataset name>
In the example below, we list the files for the dataset blog_authorship_corpus shown above using curl.
curl -s 'https://datasets-server.huggingface.co/parquet?dataset=blog_authorship_corpus' | jq
{
  "parquet_files": [
	{
  	"dataset": "blog_authorship_corpus",
  	"config": "blog_authorship_corpus",
  	"split": "train",
  	"url": "https://huggingface.co/datasets/blog_authorship_corpus/resolve/refs%2Fconvert%2Fparquet/blog_authorship_corpus/train/0000.parquet",
  	"filename": "0000.parquet",
  	"size": 301216503
	},
	{
  	"dataset": "blog_authorship_corpus",
  	"config": "blog_authorship_corpus",
  	"split": "train",
  	"url": "https://huggingface.co/datasets/blog_authorship_corpus/resolve/refs%2Fconvert%2Fparquet/blog_authorship_corpus/train/0001.parquet",
  	"filename": "0001.parquet",
  	"size": 152312736
	},
	{
  	"dataset": "blog_authorship_corpus",
  	"config": "blog_authorship_corpus",
  	"split": "validation",
  	"url": "https://huggingface.co/datasets/blog_authorship_corpus/resolve/refs%2Fconvert%2Fparquet/blog_authorship_corpus/validation/0000.parquet",
  	"filename": "0000.parquet",
  	"size": 24997972
	}
  ],
  "pending": [],
  "failed": [],
  "partial": false
}
From the above response, we can see each Parquet file is provided as a json object with the download link available through a url field.
Using clickhouse-local
For all of our examples, we use the console mode of clickhouse-local. For Linux administrators or users wishing to incorporate clickhouse-local into scripts, any query can be passed through the
--queryparameter with the response provided by stdout.
Before we query any Parquet files, let's confirm we can utilize the above API in ClickHouse using the url function. For consistency of the response, we request the output be rendered as JSON.
SELECT json
FROM url('https://datasets-server.huggingface.co/parquet?dataset=blog_authorship_corpus', 'JSONAsString')
FORMAT Vertical

Row 1:
──────
json: json: {"parquet_files":[{"dataset":"blog_authorship_corpus","config":"blog_authorship_corpus","split":"train","url":"https://huggingface.co/datasets/blog_authorship_corpus/resolve/refs%2Fconvert%2Fparquet/blog_authorship_corpus/train/0000.parquet","filename":"0000.parquet","size":301216503},{"dataset":"blog_authorship_corpus","config":"blog_authorship_corpus","split":"train","url":"https://huggingface.co/datasets/blog_authorship_corpus/resolve/refs%2Fconvert%2Fparquet/blog_authorship_corpus/train/0001.parquet","filename":"0001.parquet","size":152312736},{"dataset":"blog_authorship_corpus","config":"blog_authorship_corpus","split":"validation","url":"https://huggingface.co/datasets/blog_authorship_corpus/resolve/refs%2Fconvert%2Fparquet/blog_authorship_corpus/validation/0000.parquet","filename":"0000.parquet","size":24997972}],"pending":[],"failed":[],"partial":false}

1 row in set. Elapsed: 1.220 sec.
Examining the urls closely, we can see files reside under the path https://huggingface.co/datasets/. This seems to be consistent across datasets.
Dataset
For our sample dataset, we use maharshipandya/spotify-tracks-dataset. This represents a Spotify tracks dataset, with each row containing information for a given track over a range of 125 different genres. Each track has audio features associated with it, such as its duration, genre and tempo. Using the above url function and JSON_QUERY function, we can extract a concise list of Parquet files available for this dataset.
SELECT JSON_QUERY(json, '$.parquet_files[*].url') AS urls
FROM url('https://datasets-server.huggingface.co/parquet?dataset=maharshipandya/spotify-tracks-dataset', 'JSONAsString')

┌─urls──────────────────────────────────────────────────────────────────────────────────────────────────────────────────────────────────┐
│ ["https://huggingface.co/datasets/maharshipandya/spotify-tracks-dataset/resolve/refs%2Fconvert%2Fparquet/default/train/0000.parquet"] │
└───────────────────────────────────────────────────────────────────────────────────────────────────────────────────────────────────────┘

1 row in set. Elapsed: 0.908 sec.
With only one file, this represents one of the simplest datasets to work with in Hugging Face. In this case, we can simply query the file directly - again using the url function.
SELECT count()
FROM url('https://huggingface.co/datasets/maharshipandya/spotify-tracks-dataset/resolve/refs%2Fconvert%2Fparquet/default/train/0000.parquet')
SETTINGS enable_url_encoding = 0, max_http_get_redirects = 1

┌─count()─┐
│  114000 │
└─────────┘

1 row in set. Elapsed: 1.280 sec. Processed 77.00 thousand rows, 8.81 MB (60.16 thousand rows/s., 6.88 MB/s.)
We are required to specify the parameter max_http_get_redirects = 1. This ensures we follow the redirect to the CDN path that is returned by the Parquet file’s url. The parameter enable_url_encoding = 0, introduced in 23.7, ensures no decoding is applied to the URL - the escape characters in the path are intentional and should be preserved. For all subsequent queries assume these parameters are set in the session.
As well as requiring the addition of the parameter enable_url_encoding for this blog post, we also found reading of Hugging Face Parquet files to be slower than expected with ClickHouse. This was attributed to small row groups, with a separate HTTP request made for each row group. This was resolved in issue 53069.
To simplify subsequent requests, we can create a url table engine to abstract the url. This allows us to query the dataset with the table spotify in all subsequent queries. This table will exist for the lifetime of the clickhouse-local session.
SET max_http_get_redirects = 1
SET enable_url_encoding = 0

CREATE TABLE spotify
ENGINE=URL('https://huggingface.co/datasets/maharshipandya/spotify-tracks-dataset/resolve/refs%2Fconvert%2Fparquet/default/train/0000.parquet')

SELECT count()
FROM spotify

┌─count()─┐
│  114000 │
└─────────┘

1 row in set. Elapsed: 0.838 sec. Processed 39.00 thousand rows, 4.51 MB (46.52 thousand rows/s., 5.37 MB/s.)
All queries below use the spotify table created above.
Exploring the dataset
To identify the columns available, we can rely on ClickHouse’s type inference capabilities and issue a DESCRIBE query.
DESCRIBE TABLE spotify

┌─name─────────────┬─type──────────────┬
│ Unnamed: 0   	│ Nullable(Int64)      │
│ track_id     	│ Nullable(String)     │
│ artists      	│ Nullable(String)     │
│ album_name   	│ Nullable(String)     │
│ track_name   	│ Nullable(String)     │
│ popularity   	│ Nullable(Int64)      │
│ duration_ms  	│ Nullable(Int64)      │
│ explicit     	│ Nullable(Bool)	   │
│ danceability 	│ Nullable(Float64)    │
│ energy       	│ Nullable(Float64)    │
│ key          	│ Nullable(Int64)      │
│ loudness     	│ Nullable(Float64)    │
│ mode         	│ Nullable(Int64)      │
│ speechiness  	│ Nullable(Float64)    │
│ acousticness 	│ Nullable(Float64)    │
│ instrumentalness │ Nullable(Float64) │
│ liveness     	│ Nullable(Float64)    │
│ valence      	│ Nullable(Float64)    │
│ tempo        	│ Nullable(Float64)    │
│ time_signature   │ Nullable(Int64)   │
│ track_genre  	│ Nullable(String)     │
└──────────────────┴───────────────────┴

21 rows in set. Elapsed: 0.000 sec.
A full description of these columns is available here for those interested. We’ll provide descriptions when using a column below and its content is not obvious.
Simple queries
Before performing an analysis of a dataset in detail using more complex statistical functions, users often need to perform simple queries to understand the data.
Aggregations
Aggregations are helpful in understanding the common values in each column. Below, we identify popular artists from our dataset:
SELECT count() AS c, artists
FROM spotify
GROUP BY artists
ORDER BY c DESC
LIMIT 20

┌───c─┬─artists─────────┐
│ 279 │ The Beatles 	│
│ 271 │ George Jones	│
│ 236 │ Stevie Wonder   │
│ 224 │ Linkin Park 	│
│ 222 │ Ella Fitzgerald │
│ 217 │ Prateek Kuhad   │
│ 202 │ Feid        	│
│ 190 │ Chuck Berry 	│
│ 183 │ Håkan Hellström │
│ 181 │ OneRepublic 	│
└─────┴─────────────────┘

20 rows in set. Elapsed: 0.828 sec. Processed 114.00 thousand rows, 13.05 MB (137.73 thousand rows/s., 15.77 MB/s.)
Our later analysis will often look at differences across music genres. Ideally, this data is thus distributed evenly across genres, as indicated by a 0 variance, which should allow us to make some later statistical measurements with confidence. Confirming this with SQL is straightforward with the varPop function.
SELECT count(), track_genre
FROM spotify
GROUP BY track_genre
LIMIT 10

┌─count()─┬─track_genre─┐
│	1000  │ indie   	│
│	1000  │ salsa   	│
│	1000  │ new-age 	│
│	1000  │ swedish 	│
│	1000  │ j-dance 	│
│	1000  │ garage  	│
│	1000  │ latino  	│
│	1000  │ malay   	│
│	1000  │ rock    	│
│	1000  │ sad     	│
└─────────┴─────────────┘

10 rows in set. Elapsed: 0.848 sec. Processed 39.00 thousand rows, 4.48 MB (45.97 thousand rows/s., 5.28 MB/s.)

SELECT uniqExact(track_genre)
FROM spotify

┌─uniqExact(track_genre)─┐
│                	114  │
└────────────────────────┘


1 row in set. Elapsed: 0.822 sec. Processed 114.00 thousand rows, 13.05 MB (138.62 thousand rows/s., 15.87 MB/s.)

SELECT varPop(c)
FROM
(
	SELECT
    	count() AS c,
    	track_genre
	FROM spotify GROUP BY track_genre
)

┌─varPop(c)─┐
│     	0   │
└───────────┘


11 row in set. Elapsed: 0.881 sec. Processed 39.00 thousand rows, 4.51 MB (44.26 thousand rows/s., 5.11 MB/s.)
We can see that each genre has 1000 rows. A variance of 0 proves this is the same for all 114 genres in the dataset.
Histograms
Any early data analysis typically involves building histograms to show the distribution of our values and identify the likely probability distribution. For example, let's consider the column danceability:
Danceability considers how suitable a track is for dancing based on a combination of musical elements including tempo, rhythm stability, beat strength, and overall regularity. A value of 0.0 is least danceable and 1.0 is most danceable.
Histograms can easily be constructed using the bar function. Below, we group by danceability, rounded to 1 decimal place, and plot the count. This gives us the distribution of the values.
SELECT
	round(danceability, 1) AS danceability,
	bar(count(), 0, max(count()) OVER ()) AS dist
FROM spotify
GROUP BY danceability
ORDER BY danceability ASC

┌─danceability─┬─dist─────────────────────────────────────────────────────────────────────────────┐
│       0      │ ▍                                                                            	  │
│      	0.1    │ ████▎                                                                        	  │
│      	0.2    │ █████████████▍                                                               	  │
│      	0.3    │ ████████████████████████                                                     	  │
│      	0.4    │ ████████████████████████████████████████████▋                                	  │
│      	0.5    │ ████████████████████████████████████████████████████████████████████▊        	  │
│      	0.6    │ ████████████████████████████████████████████████████████████████████████████████ │
│      	0.7    │ ██████████████████████████████████████████████████████████████████████       	  │
│      	0.8    │ ██████████████████████████████████████████                                   	  │
│      	0.9    │ ██████████▋                                                                  	  │
│       1      │ ▌                                                                            	  │
└──────────────┴──────────────────────────────────────────────────────────────────────────────────┘

11 rows in set. Elapsed: 0.839 sec. Processed 39.00 thousand rows, 4.48 MB (46.51 thousand rows/s., 5.34 MB/s.)
Above we use the window function max(count()) OVER () to determine the max count for each group, thus avoiding the need for us to specify a constant as the upper bound for the bar function.
One of the values of histograms is their ability in helping to quickly and visually determine if a value is normally distributed, opening the possibility for other statistical techniques to be applied. Below, we explore some of the other columns using the same query.
Energy is a measure from 0.0 to 1.0 and represents a perceptual measure of intensity and activity. Typically, energetic tracks feel fast, loud, and noisy. For example, death metal has high energy, while a Bach prelude scores low on the scale
┌─energy─┬─dist─────────────────────────────────────────────────────────────────────────────┐
│  	0    │ ███████▍                                                                     	│
│	0.1  │ ███████████████▎                                                             	│
│	0.2  │ ████████████████████▌                                                        	│
│	0.3  │ ███████████████████████████▉                                                 	│
│	0.4  │ █████████████████████████████████████▌                                       	│
│	0.5  │ ███████████████████████████████████████████████▌                             	│
│	0.6  │ █████████████████████████████████████████████████████████▎                   	│
│	0.7  │ ███████████████████████████████████████████████████████████████████▌         	│
│	0.8  │ ██████████████████████████████████████████████████████████████████████▏      	│
│	0.9  │ ████████████████████████████████████████████████████████████████████████████████ │
│  	1    │ ███████████████████████████████████████▊                                     	│
└────────┴──────────────────────────────────────────────────────────────────────────────────┘
Liveliness measures the presence of an audience in the recording. Higher liveness values represent an increased probability that the track was performed live. A value above 0.8 provides strong likelihood that the track is live
It seems unlikely this will be normally distributed, with most music recorded in a studio - resulting in a left skew.
┌─liveness─┬─dist─────────────────────────────────────────────────────────────────────────────┐
│    	0  │ ███▍                                                                         	  │
│  	  0.1  │ ████████████████████████████████████████████████████████████████████████████████ │
│  	  0.2  │ ████████████████████████▎                                                    	  │
│  	  0.3  │ █████████████████▊                                                           	  │
│  	  0.4  │ █████████▌                                                                   	  │
│  	  0.5  │ ██▉                                                                          	  │
│  	  0.6  │ ██▌                                                                          	  │
│  	  0.7  │ ██▉                                                                          	  │
│  	  0.8  │ █▊                                                                           	  │
│  	  0.9  │ ██▏                                                                          	  │
│    	1  │ █▍                                                                           	  │
└──────────┴──────────────────────────────────────────────────────────────────────────────────┘
This isn't always the most efficient way to build a histogram. Here we’re identified the range (0-1) and controlled the interval (0.1), but rounding to a single decimal place. This works well on this fixed scale but is more challenging when we don’t know the range. For columns where the data range is less understood or fixed, we can use the histogram function. Here, we can just specify the number of buckets we need and then reuse the bar to plot.
As an example, let's consider loudness.
Loudness is the overall loudness of a track in decibels (dB)
WITH (
    	SELECT histogram(20)(loudness)
    	FROM spotify
	) AS hist
SELECT
	round(arrayJoin(hist).1) AS lower,
	round(arrayJoin(hist).2) AS upper,
	bar(arrayJoin(hist).3, 0, max(arrayJoin(hist).3)) AS bar
ORDER BY arrayJoin(hist).1 ASC

┌─lower─┬─upper─┬─bar──────────────────────────────────────────────────────────────────────────────┐
│   -50 │   -48 │                                                                              	   │
│   -48 │   -45 │                                                                              	   │
│   -45 │   -41 │                                                                              	   │
│   -41 │   -38 │                                                                              	   │
│   -38 │   -35 │ ▎                                                                            	   │
│   -35 │   -32 │ ▍                                                                            	   │
│   -32 │   -30 │ ▊                                                                            	   │
│   -30 │   -27 │ █                                                                            	   │
│   -27 │   -25 │ █▋                                                                           	   │
│   -25 │   -21 │ ███▎                                                                         	   │
│   -21 │   -18 │ █████▋                                                                       	   │
│   -18 │   -15 │ ██████▉                                                                      	   │
│   -15 │   -13 │ ██████████▉                                                                  	   │
│   -13 │   -11 │ ██████████████████████                                                       	   │
│   -11 │	-8  │ ████████████████████████████████████████████▏                                	   │
│	-8  │	-6  │ ████████████████████████████████████████████████████████████████▉            	   │
│	-6  │	-3  │ ████████████████████████████████████████████████████████████████████████████████ │
│	-3  │	-1  │ ██████████████████▏                                                          	   │
│	-1  │ 	2   │ █                                                                            	   │
│ 	2   │ 	5   │                                                                              	   │
└───────┴───────┴──────────────────────────────────────────────────────────────────────────────────┘

20 rows in set. Elapsed: 0.883 sec. Processed 114.00 thousand rows, 13.05 MB (129.03 thousand rows/s., 14.77 MB/s.)
Sparkbars
While histograms are great, suppose we want to understand the distribution of values for a specific column over subsets. For example, how does track duration vary by genre? We could, rather tediously, generate a histogram for each genre and compare them. The sparkbar function allows us to do this more efficiently in a single query.
Below, we visualize the distribution of track length for each genre. This requires us to group by genre and track length, rounded to the nearest 10s. We use the results of this subquery to build a spark bar for each genre, consisting of 50 buckets.
SELECT
	track_genre,
	sparkbar(40)(CAST(duration_ms, 'UInt32'), c) AS distribution
FROM
(
	SELECT
    	track_genre,
    	count() AS c,
    	duration_ms
	FROM spotify
	GROUP BY
    	track_genre,
    	round(duration_ms, -4) AS duration_ms
	ORDER BY duration_ms ASC
) WHERE (duration_ms >= 60000) AND (duration_ms <= 600000)
GROUP BY track_genre
ORDER BY track_genre ASC

┌─track_genre───────┬─distribution─────────────────────────────┐
│ acoustic      	│ ▁▁▁▁▁▂▃▄▅▅▇▆█▇▆▄▃▂▁▂▁▁▁▁▁ ▁  ▁     	▁  │
│ afrobeat      	│ ▁▁ ▁▁▂▂▃▄▅▆▇▇█▆▅▃▂▃▂▂▁▂▁▁▁▁▁▁▁▁▁▁▁▁▁▁▁▁▁ │
│ alt-rock      	│ ▁  ▁▁▂▂▄▅▇█▇▇▅▄▃▂▂▂▁▁▁▁▁▁ ▁▁▁▁  ▁  ▁   ▁ │
│ alternative   	│ ▁ ▁▂▂▂▃▅▆▅▇▇█▆▄▅▄▂▂▂▁▁▁▁▁▁▁▁   ▁▁▁▁ ▁  ▁ │
│ ambient       	│ ▁▂▃▂▄▄▄▅▆▅█▅▅▄▅▄▅▄▂▃▂▂▂▁▁▁▁▁▁▁▁▁▁▁▁▁▁▁ ▁ │
│ anime         	│ ▁▂▃▃▃▃▃▃▄▆▄▅▆▆█▆▅▄▂▂▁▂▂▁▁▁▁ ▁ ▁  ▁  ▁  ▁ │
│ black-metal   	│ ▁▁▁▁▂▂▃▂▃▄▄█▆▅▆▇▇▆▆▅▆▄▄▃▃▃▂▃▂▂▂▁▂▁▁▁▁▁▁▁ │
│ bluegrass     	│ ▁▁▁▂▃▃▅▆▇▇▇█▆▄▄▄▃▃▂▂▂▁▁▁▁▁ ▁▁▁▁▁▁▁▁▁ ▁▁▁ │
│ blues         	│ ▁▁▁▃▂▃▇█▅▅▆▄▄▄▃▃▃▂▂▁▂▁▁▁▁▁▁▁▁ ▁  ▁  ▁  ▁ │
│ brazil        	│ ▁  ▁▁▂▃▅▅▇█▆▇▆█▆▅▅▄▃▃▂▂▂▂▂▁▁▁▁▁▁▁▁▁▁▁▁▁▁ │
│ breakbeat     	│ ▁▁ ▁▁▁▁▁▃▄▇▆▅▇▇█▆▅▅▅▃▄▂▃▃▃▂▂▂▂▁▁▂▁▁ ▁ ▁▁ │
│ british       	│ ▁▁▂▁▃▄▅▇▆▆▅█▆▆▅▃▃▃▂▁▁▁▁▂▁▁▁▁▁ ▁▁▁▁	▁▁ │
│ cantopop      	│ ▁▁▁▁▁▂▃▃▂▂▃▅▆█▆▆▄▃▂▁▁▁▁▁   	▁   	▁  │
│ chicago-house 	│ ▁ ▁ ▁▁▂▂▂▄▃▅▄▅▅▅▆▆▇▇▆▅█▆▆▆▅▄▃▃▃▃▂▃▁▂▂▁▁▁ │
│ children      	│ ▄▅▅▇▆ ▆▅▆█▆ ▅▆▅▅▄ ▄▂▃▂ ▁▁▁▁▁ ▁▁ ▁▁ ▁▁  ▁ │
│ chill         	│ ▁▁▂▃▂▅▄▇▆█▇▇▄▆▄▃▂▂▂▂▁▁▁▁▁ ▁▁▁▁▁  ▁ 	▁  │
│ classical     	│ ▇█▇▂▂▂▄▄▃▃▃▃▂▃▃▂▂▃▃▂▂▁▁▁▂▁▂▁▁▂▁▁▁▁▁▁ ▁▁▁ │
│ club          	│ ▁▁▁▂▃▃▄▄▄▆▇▇▆█▆▅▄▃▃▂▂▂▁▁▁▁▁▁▁▁▁▁▁   ▁  ▁ │
│ comedy        	│ ▄▃▄▆▆▇█▇▇▆▇▆▅▅▅▃▆▄▃▂▃▃▁▁▂▂▂▂▁▁▁▁▁ ▁▁ ▁▁▁ │
│ country       	│ ▁   ▂▂▂▄▆▆█▇▆▆▃▂▂▂▁▁ ▁▁▁▁ ▁  ▁     	▁  │
│ dance         	│ ▁   ▁▁▁▂▂▃▄▆▆█▆▅▃▂▃▃▁▁▁▁▁▁▁▁▁ ▁▁▁  ▁  ▁▁ │
│ dancehall     	│ ▁ ▁▁▁▁▁▂▄▆▆█▇▇▇▆▄▃▂▁▁▁▁▁  ▁  ▁▁▁   ▁ ▁ ▁ │
│ death-metal   	│ ▁▁▂▁▂▃▂▄▃▅▆▇█▇▆▇▅▄▄▃▂▂▁▁▁▂▁▁▁▁▁▁▁▁ ▁▁▁ ▁ │
│ deep-house    	│ ▁▂▃▅▆█▇▅▅▃▂▁▁▁▁▁▁▁▁▁▁▁▁▁▁▁▁▁▁▁▁▁▁▁ ▁▁▁▁▁ │
│ detroit-techno	│ ▁▁▁▁▁▁▂▂▂▄▅▃▄▅▄▅▄▅▅▆▇▄█▅▆▇▆▅▅▄▄▃▂▃▂▁▁▁▂▁ │
│ disco         	│ ▁▁  ▁▂▃▅▆█▆▅▆▅▃▂▂▂▂▁▁▁▂▁▁▁▁▁▁▁▁▁ ▁▁▁   ▁ │
│ disney        	│ ▃▆▇▄▄▇▇▆█▅▆▇▅▅▅▄▃▃▃▂▁▂▁▁▁▁▁▁▁▁▁▁▁▁ ▁ ▁ ▁ │
│ drum-and-bass 	│ ▁ ▁▁ ▁ ▁▂▂▃▅▅▄▅▄█▅▄▄▄▃▃▂▂▁▁▁▁▁▁▁ ▁▁▁▁▁ ▁ │
│ dub           	│ ▁▁▁ ▁ ▁▂▂▂▄▃▅█▆▇▇▇▅▄▃▃▂▂▂▂▁▁▁▁▁▁▁▁▁▁▁ ▁▁ │
│ dubstep       	│ ▁▁▁▁ ▁▁▁▂▁▃▄▄▅█▆▇▇▆▅▃▃▂▂▂▁▁▁▁▁▁▁▁ ▁▁▁  ▁ │
│ edm           	│ ▁  ▁▁▁▂▂▄▅ ▇█▅▆▆▄▂▂▂ ▁▁▁▁▁▁▁▁▁  ▁▁▁   ▁▁ │
│ electro       	│ ▁▁▁▁▂▄▄▆▇▆ ▄█▃▃▂▂▁▁▁ ▁▁▁▁ ▁▁▁▁     	▁  │
│ electronic    	│ ▁▁▁▁▂▃▄▆█▇▇▆▆▄▄▃▂▂▂▂▂▁▁▁▁▁▁▁▁▁▁▁▁▁▁ ▁▁▁▁ │
│ emo           	│ ▁▂▂▃▄▅▆█▇▇▇▇█▅▅▂▂▂▂▂▁▁▁ ▁▁▁▁▁ ▁  ▁ 	▁  │
│ folk          	│ ▁ ▁▁▁▁▂▃▃▅▇█▇▅▆▄▅▄▃▂▂▂▁▁▁▁▁▁▁▁▁▁▁▁▁ ▁  ▁ │
│ forro         	│ ▁▁▁▁▂▃▅▆▆█▇▅▇▄▅▃▃▃▂▁▁▁▁▁▁▁▁ ▁▁ ▁▁	▁ ▁    │
│ french        	│ ▁▁▁▁▂▃▅▅█▇▇▆▅▃▃▂▂▁▁▂▁▁▁ ▁▁▁ ▁▁ ▁   ▁   ▁ │
│ funk          	│ ▁ ▁▁▂▂▅▇█▆▅▆▄▃▄▃▂▂▁▁▁▁▁▁▁▁▁▁▁▁▁ ▁▁▁▁▁▁▁▁ │
│ garage        	│ ▁▁▁▁▂▃▃▄▄▅█▆▅▆▅▄▃▂▂▁▁▁▁▁▁▁ ▁▁▁▁▁▁  ▁   ▁ │
│ german        	│ ▁▂▂▁▂▄▆▆▇█▆▅▆▄▃▂▁▂▃▁▁▁▁▁▁▁▁▁▁▁▁▁▁▁▁▁▁▁▁▁ │
│ gospel        	│ ▁ ▁▁▁▁▁▁▂▂▃▃▄▅█▇▅▅▄▃▃▂▂▂▂▂▁▁▂▁▁▁▁▁ ▁▁▁▁▁ │
│ goth          	│ ▁▁ ▁▁▂▂▄▄▅█▅▇▇▅▅▅▅▅▃▃▂▂▁▁▂▁▁▁▁▁ ▁▁  ▁▁▁▁ │
│ grindcore     	│ █▇▆▄▄▄▄▃▃▄▃▃▃▂▂▃▂▁▁▁▁▁▁▁▁▁▁▁▁ ▁▁▁   ▁  ▁ │
│ groove        	│ ▁ ▁▁▁▂▄▆▆█▆▆▆▅▅▅▃▄▃▂▂▂▁▂▂▁▁▁▁▁▁▁▁▁▁▁▁  ▁ │
│ grunge        	│ ▁▁▁▁▁▁▂▂▄▄▆▇█▅▅▅▃▂▂▁▁▁▁▁▁▁▁▁▁▁  ▁ ▁▁   ▁ │
│ guitar        	│ ▁▁▂▂▃▄▆▅▇▇█▇▇▄▃▃▃▃▃▂▁▂▂▁▂▁▁▁▁▁ ▁▁  ▁▁ ▁▁ │
│ happy         	│ ▁▁▁▁▁▂▂▃▅█▇▇▇▅▄▃▃▃▄▃▃▂▂▂▁▁▁▁▁▁ ▁  ▁▁   ▁ │
│ hard-rock     	│ ▁▂▁▂▂▂▄▇▆▆█▇▇▆▇▇▃▄▄▃▂▃▂▂▁▂▁▁▁▁▁▁▁▁ ▁▁▁▁▁ │
│ hardcore      	│ ▁▂▂▂▃▄▃▄▆▅▆▇█▇▆▄▄▃▃▂▂▁▁ ▁▁▁  ▁  ▁  	▁  │
│ hardstyle     	│ ▁ ▁▁▁▁▁▂▄▆▇█▅▆▅▅▃▂▃▂▂▁▁▁▁▂▁▁▁▁▁▁▁▁▁▁▁ ▁▁ │
│ heavy-metal   	│ ▁▁▁▁▁▁▂▂▃▄▅▆▆▆█▅▅▄▄▃▃▂▂▁▁▁▁▁▁▁▁▁▁▁  ▁  ▁ │
│ hip-hop       	│ ▁▁▁▁▁▁▁▃▃▆▅█▇▆▅▄▃▃▂▂▁▁▁▁▁▁▁▁▁▁▁ ▁	▁▁▁    │
│ honky-tonk    	│ ▁▁▁▁▁ ▂▂▄▅ ▇█▆▅ ▃▂▁▁ ▁▁▁▁ ▁▁	▁  	▁      │
│ house         	│ ▁ ▁▂▃▅▇▇ █▆▇▆▄▂▂ ▂▁▁▁▁▁▁  ▁▁▁▁▁▁ 	▁ ▁    │
│ idm           	│ ▂▁▂▂▂▂▂▄▄▅▆▆▅▆█▇▅▆▄▄▄▄▃▂▃▂▂▁▂▁▁▁▂▁▁▁▁▁ ▁ │
│ indian        	│ ▁▁▁▁▁▁▂▃▄▅▆▆▇█▆▆▅▆▆▅▄▃▂▂▁▂▁▁▁▁▁▁  ▁  ▁ ▁ │
│ indie         	│ ▁▁▁▁▁▁▃▃▅▅▅▆█▅▇▅▅▅▃▃▃▁▃▂▁▁▁▁▁ ▁▁▁▁ ▁   ▁ │
│ indie-pop     	│ ▁ ▁▁▁▄▃▄▅█▇▅▆▆▄▃▃▂▂▁▁▁▁▁ ▁▁▁▁▁▁▁ ▁ 	▁  │
│ industrial    	│ ▁▁▁▁▁▂▂▂▄▃▆█▆▆▅▅▄▄▄▃▂▂▂▂▁▁▁▁▁▁▁▁▁▁▁  ▁ ▁ │
│ iranian       	│ ▄▂▂▂▂▂▂▃▃▅▆▅▆▆▆▇▅▇█▆▇▅▅▅▄▄▅▃▂▂▃▁▂▂▁▂▁▁▂▁ │
│ j-dance       	│ ▁▁ ▁▁▁▁▁▂▄▅▆█▇▆▅▄▂▃▁▁▁▁▁▁▁▁▁▁▁▁  ▁  ▁  ▁ │
│ j-idol        	│ ▁▁▁ ▁▁▁▁▂▂▃▅▅▇█▆▆▄▄▂▂▁▁▁▁▁   ▁     	▁  │
│ j-pop         	│ ▁▁▁▁▁▁▂▂▂▄▆▆▆▆▇▆█▄▃▂▂▂▂▁▁▁▁ ▁▁ ▁▁  ▁   ▁ │
│ j-rock        	│ ▁▂ ▁▁▁▂▂▄▅▆▇█▇▇▅▄▃▂▂▃▁▁▁▁▁▁▁▁  ▁  ▁▁▁  ▁ │
│ jazz          	│ ▁▂ ▁▆▄▆▄▆█▅▄▃▃▂▂▁▁▁▁▁▁▁▁▁ ▁▁▁  ▁▁	▁▁▁    │
│ k-pop         	│ ▁▁▁▁▁▁▁▂▅▆▆█▅▇▆▄▄▃▄▃▃▂▂▁▁▁▁▁▁▁▁▁▁ ▁▁▁ ▁▁ │
│ kids          	│ ▄▄▄▅█▆▆▇▆▆▆▅▄▃▂▁▁▁▁▁ ▁▁ ▁▁▁     	▁  ▁   │
│ latin         	│ ▁	▁▂▁ ▂▃▅▄ ▇▆█ ▆▆▆▃ ▄▂▂ ▁▁▁▁ ▁▁	▁▁     │
│ latino        	│ ▁▁▁▂▂ ▁▂▄▅▄ █▆▆▆▅ ▅▃▃▂ ▂▁▁▁▁ ▁▁ ▁   ▁ ▁▁ │
│ malay         	│ ▁▁▁▁▁▂▃▃▄▅▇▆▇▆▇█▇▅▄▃▃▃▂▁▁▁▁▁▁▁▁▁▁▁  ▁▁▁▁ │
│ mandopop      	│ ▁   ▁ ▁▁▁▁▂▂▂▄▅▇▆█▇▅▄▂▂▂▁▁▁▁▁▁ ▁ ▁ 	▁  │
│ metal         	│ ▁▁▁▁▁▁▁▂▃▄▅█▆▆▄▃▃▃▂▃▁▂▂▁▁▁▁▁▁▁▁▁▁▁▁▁▁ ▁▁ │
│ metalcore     	│ ▁▁▁▁▁▁▂▂▄▆▇▇█▅▄▃▃▂▁▁▁▁▁▁▁▁▁  ▁ ▁ ▁▁	▁  │
│ minimal-techno	│ ▁  ▁▁▂▂▂▂▂▄▇▄▄▄▄▅▄▄▅▄▆▆█▇▆▆▅▆▅▄▄▅▂▂▂▂▁▁▁ │
│ mpb           	│ ▁▁▁▁▁▁▂▃▄▅█▇▇▆▄▄▃▃▂▂▁▁▁▁▁▁▁▁▁ ▁ ▁	▁▁▁    │
│ new-age       	│ ▁▁▁▁▂▂▄▄▄▇▇▆█▇▇▅▄▆▄▄▄▃▃▃▃▂▂▂▂▁▂▁▁▁▂▁▁▁▁▁ │
│ opera         	│ ▁▁▂▂▂▂▃▄▄▆▆█▆▇▆▅▃▃▂▂▁▁▁▁▁▁▁▁▁▁ ▁  ▁ ▁▁▁▁ │
│ pagode        	│ ▁▁▁▁▂▄▅▆▇█▆▅▃▃▂▂▂▁▁▁▁▁▁▁▁▁▁▁ ▁▁▁▁  	▁  │
│ party         	│ ▁▁ ▁▁▁▁▂▃▄▅█▆▆▆▃▁▁▁▁▁  ▁  ▁	▁   	▁  │
│ piano         	│ ▁▁▁▂▄▄█▆▇▅▇▆▆▇▅▃▂▃▂▂▁▁▁▁▁▁▁▁▁ ▁▁   	▁  │
│ pop           	│ ▁▁▁▁▁▁▂▄█▇▇▅▆▅▄▃▂▂▂▁▁▁▁▁▁▁▁   ▁ ▁  	▁  │
│ pop-film      	│ ▁▁▁▁▁▁▁▁▂▃▄▅▅▆▇▇▇█▇▆▇▄▃▃▂▁▁▁▁▁▁▁ ▁▁ ▁  ▁ │
│ power-pop     	│ ▁▂▂▃▃▄▆▅▆▇▆█▇▅▆▆▄▄▄▃▂▁▁▁▁▁▁▁▁▁▁▁▁ ▁▁  ▁▁ │
│ progressive-house │ ▁▁▁▁▂▅▆█▇▇▇▄▂▂▁▂▁▂▁▁▁▁▁▁▁▁▁▁▁▁   ▁▁ ▁▁ ▁ │
│ psych-rock    	│ ▁▁▁▄▃▄▅█▆▄▅▄▃▃▃▃▁▁▂▂▁▁▁▁▁▁▁▁▁ ▁ ▁▁▁▁▁▁▁▁ │
│ punk          	│ ▁▁▁▁▃▂▃▅▆▆▇█▅▃▃▃▂▂▁▁▁▁▁▁▁▁▁▁  ▁▁ ▁  ▁  ▁ │
│ punk-rock     	│ ▁▁▁▁▂▂▃▄▆▆▇█▅▄▄▃▂▁▁▁▁▁ ▁▁▁▁▁▁ ▁  ▁▁ ▁  ▁ │
│ r-n-b         	│ ▁ ▁▂▃▃█▅▆▇▇▅▄▄▃▂▂▂▁▁▁▁▁▁▁▁▁▁▁▁▁  ▁ ▁ ▁▁▁ │
│ reggae        	│ ▂▁▂▃▄▅▇▇█▅▆▅▃ ▃▂▂▁▁▁▁▁▁▁ ▁ ▁▁ ▁▁▁  	▁  │
│ reggaeton     	│ ▁   ▁▁▂▃ ▄▅█▇▇▅▅ ▄▃▃▁▂▁▁ ▁▁▁▁▁▁   ▁ ▁▁ ▁ │
│ rock          	│ ▁▁▁▄▁▂▂▄▃▅▆▆▆█▅▄▃▂▂▂▁▁▁▁▁▁▁▁▁ ▁  ▁▁  ▁ ▁ │
│ rock-n-roll   	│ ▁▁▁▂▄▅█▅▃▃▂▂▂▁▁▁▁▁ ▁▁▁▁ ▁          	▁  │
│ rockabilly    	│ ▁▁▁▁ ▅▅▅ ▅█▄ ▃▃▃ ▂▂▂ ▂▁▂ ▁▁▁ ▁▁  ▁▁  ▁▁▁ │
│ romance       	│ ▁▁▁▁▂▂▄▄▇█▇▇▆▄▃▄▃▂▁▂▁▁▁▁▁▁▁▁ ▁ ▁ ▁ ▁  ▁▁ │
│ sad           	│ ▁▁ ▁▂ ▄▃ ▆ ▇▇ █▆ ▅ ▅▄ ▃▂ ▂ ▁▁ ▁▁ ▁ ▁▁ ▁▁ │
│ salsa         	│ ▁ ▁▂▂▂▂▃▃▃▅▅▆█▇▇▅▃▂▂▂▁▁▁▁▁▁▁ ▁▁▁ ▁ ▁ ▁ ▁ │
│ samba         	│ ▁▁▂▂▂▂▂▃▅▄▇▆▆█▅▅▄▃▃▂▂▁▁▁▁▁▁▁▁▁  ▁▁  ▁  ▁ │
│ sertanejo     	│ ▁▁▃▅▇▇█▅▄▄▄▂▁▁▂▁▁▁▁▁▁▁▁▁▁          	▁  │
│ show-tunes    	│ ▂▂▃▃▃▄▄▆▆▄▆█▄▅▄▃▂▂▂▂▁▂▁▁▁▁▁▁▁▁ ▁▁▁▁ ▁▁▁▁ │
│ singer-songwriter │ ▁▁▁▁▁▁▂▃▄█▄▅▆▅▅▄▂▂▂▁▁▁▁▁▁▁▁▁▁▁▁▁ ▁  ▁▁ ▁ │
│ ska           	│ ▁▁▁▁▂▂▃▄▅▆▇█▇▅▆▃▃▃▂▂▂▁▁▁▁▁▁ ▁▁▁ ▁ ▁   ▁▁ │
│ sleep         	│ ▄▅▅▃▇▆▄▅▆█▅▄▃▃▂▁▁▁▁▁▁ ▁▁ ▁▁ ▁   ▁ ▁  ▁▁▁ │
│ songwriter    	│ ▁▁▁▁▁▁▂▃▄█▄▅▆▅▅▄▂▂▂▁▁▁▁▁▁▁▁▁▁▁▁▁ ▁  ▁▁ ▁ │
│ soul          	│ ▁▁ ▁▂▅▆▇█▅▄▄▃▃▂▂▁▁▁▁▁▁▁▁▁▁▁▁  ▁    	▁  │
│ spanish       	│ ▁▁ ▁▁▂▄▄▅█▇▇▆▅▄▂▂▂▂▁▁▁▁▁▁ ▁▁ ▁ ▁ ▁   ▁ ▁ │
│ study         	│ ▁▁ ▂▃ ▄ ▅▇ █ ▆▅ ▃ ▂▂ ▁ ▁▁ ▁ ▁▁ ▁ ▁▁ ▁ ▁▁ │
│ swedish       	│ ▁▁▁ ▁▁▂▂▄▆█▅▅▄▄▂▂▂▂▁▁▁▁▁▁▁▁▁▁ ▁▁▁  	▁  │
│ synth-pop     	│ ▁▁▁▁▁▁▁▂▄▄▅▇█▇▇▅▃▃▃▂▂▂▁▁▁▁▁▁▁ ▁▁▁▁▁▁▁▁ ▁ │
│ tango         	│ ▁▁▁▁▃▅▆█▇▆▅▃▂▂▂▁▁▁▁▁▁▁▁▁▁▁  ▁  ▁ ▁ ▁   ▁ │
│ techno        	│ ▁▁▁▁▁▁▂▃▄▅█▇▆▄▃▃▃▃▃▃▃▃▃▄▄▄▃▄▂▃▂▂▂▁▁▁▁▁ ▁ │
│ trance        	│ ▁▁▁▁▄▃▅▅▅█▇▆▅▃▃▂▃▂▂▃▂▂▂▃▂▃▂▂▂▂▂▃▂▁▁▁▁▁▁▁ │
│ trip-hop      	│ ▁▁ ▁▁▁▁▁▃▄▇▇█▇▆▆▅▆▅▄▄▃▃▂▂▂▁▁▁▁▁▁▁▁▁▁▁▁▁▁ │
│ turkish       	│ ▁▁▁▁▁▁▃▃▃▄▆█▇▇▅▆▅▅▅▄▂▂▂▂▁▁▁▁▁▁ ▁▁▁▁ ▁  ▁ │
│ world-music   	│ ▁▁▁▁▂▁▁▁▂▂▅▅▇█▅▇▅▆▄▄▃▃▂▃▂▂▂▂▁▂▁▁▁▁▁▁▁▁▁▁ │
└───────────────────┴──────────────────────────────────────────┘

114 rows in set. Elapsed: 0.836 sec. Processed 39.00 thousand rows, 4.51 MB (46.64 thousand rows/s., 5.39 MB/s.)
We leave it to readers to extract insights on their favorite genre. As you might expect children's (kids/children) is generally quite short, but has more in common with the interesting genre of grindcore than you might initially think!
Statistical Functions
With a basic understanding of the properties and distribution of our data, we can now use ClickHouse to perform a deeper statistical analysis. ClickHouse supports additional analytical functions to simplify queries which otherwise might be quite complex. We explore some of these capabilities below.
Correlations
Understanding how columns correlate in a dataset is a first step in any statistical analysis, providing the foundation of subsequent Machine Learning by assisting with tasks such as feature selection.
We have a number of correlation functions in ClickHouse to assist with this. Classically, a correlation matrix is a decent first attempt at understanding the linear relationships in the data. The corrMatrix function allows this to be achieved succinctly:
SELECT corrMatrix(tempo, danceability, energy, loudness, speechiness, acousticness, instrumentalness, liveness)
FROM spotify

┌─corrMatrix(tempo, danceability, energy, loudness, speechiness, acousticness, instrumentalness, liveness)───────────────────────────────────────────────────────────────────────────────────────────────────────────────────────────────────────────────────┐
│ [[1,-0.05044987143124536,0.24785050980263046,0.21244589657950352,0.017273223330482177,-0.20822414719632454,-0.05033040132787979,0.0005997673112923729],[-0.05044987143124536,1,0.1343254834689951,0.2590767331737369,0.10862608966979727,-0.17153333095375695,-0.185606249730123,-0.13161685668572762],[0.24785050980263046,0.1343254834689951,1,0.7616899598908039,0.14250886780871763,-0.7339063209686977,-0.18187921111248384,0.18479552229595278],[0.21244589657950352,0.2590767331737369,0.7616899598908039,1,0.060826328125056596,-0.5898026667486788,-0.4334768619919035,0.07689866201094041],[0.017273223330482177,0.10862608966979727,0.14250886780871763,0.060826328125056596,1,-0.0021863357894036767,-0.08961576482389075,0.20521905734843637],[-0.20822414719632454,-0.17153333095375695,-0.7339063209686977,-0.5898026667486788,-0.0021863357894036767,1,0.10402711936289526,-0.020700360822699642],[-0.05033040132787979,-0.185606249730123,-0.18187921111248384,-0.4334768619919035,-0.08961576482389075,0.10402711936289526,1,-0.07989258226234942],[0.0005997673112923729,-0.13161685668572762,0.18479552229595278,0.07689866201094041,0.20521905734843637,-0.020700360822699642,-0.07989258226234942,1]] │
└────────────────────────────────────────────────────────────────────────────────────────────────────────────────────────────────────────────────────────────────────────────────────────────────────────────────────────────────────────────────────────────┘

1 row in set. Elapsed: 0.844 sec. Processed 40.00 thousand rows, 4.53 MB (47.38 thousand rows/s., 5.37 MB/s.)
Ok, admittedly this is pretty hard to interpret! A little more SQL, using ClickHouse's array functions, is required for the nice grid most of us are used to.
WITH matrix AS
    (
        SELECT arrayJoin(arrayMap(x -> arrayPushFront(x.2, x.1), arrayZip(['tempo', 'danceability', 'energy', 'loudness', 'speechiness', 'acousticness', 'instrumentalness', 'liveness'],
        arrayMap(row -> arrayMap(col -> round(col, 3), row),  corrMatrix(tempo, danceability, energy, loudness, speechiness, acousticness, instrumentalness, liveness))::Array(Array(String))))) AS matrix
        FROM spotify
    )
SELECT
    matrix[1] AS ` `,
    matrix[2] AS tempo,
    matrix[3] AS danceability,
    matrix[4] AS energy,
    matrix[5] AS loudness,
    matrix[6] AS speechiness,
    matrix[7] AS acousticness,
    matrix[8] AS instrumentalness,
    matrix[9] AS liveness
FROM matrix
┌─ ────────────────┬─tempo──┬─danceability─┬─energy─┬─loudness─┬─speechiness─┬─acousticness─┬─instrumentalness─┬─liveness─┐
│ tempo            │ 1      │ -0.05        │ 0.248  │ 0.212    │ 0.017       │ -0.208       │ -0.05            │ 0.001    │
│ danceability     │ -0.05  │ 1            │ 0.134  │ 0.259    │ 0.109       │ -0.172       │ -0.186           │ -0.132   │
│ energy           │ 0.248  │ 0.134        │ 1      │ 0.762    │ 0.143       │ -0.734       │ -0.182           │ 0.185    │
│ loudness         │ 0.212  │ 0.259        │ 0.762  │ 1        │ 0.061       │ -0.59        │ -0.433           │ 0.077    │
│ speechiness      │ 0.017  │ 0.109        │ 0.143  │ 0.061    │ 1           │ -0.002       │ -0.09            │ 0.205    │
│ acousticness     │ -0.208 │ -0.172       │ -0.734 │ -0.59    │ -0.002      │ 1            │ 0.104            │ -0.021   │
│ instrumentalness │ -0.05  │ -0.186       │ -0.182 │ -0.433   │ -0.09       │ 0.104        │ 1                │ -0.08    │
│ liveness         │ 0.001  │ -0.132       │ 0.185  │ 0.077    │ 0.205       │ -0.021       │ -0.08            │ 1        │
└──────────────────┴────────┴──────────────┴────────┴──────────┴─────────────┴──────────────┴──────────────────┴──────────┘

8 rows in set. Elapsed: 0.714 sec. Processed 2.00 thousand rows, 232.29 KB (2.80 thousand rows/s., 325.17 KB/s.)
Maybe unsurprisingly, energy is positively correlated with loudness! Maybe a little more insightful is the negative correlation between acousticness ("A confidence measure from 0.0 to 1.0 of whether the track is acoustic; 1.0 represents high confidence the track is acoustic'') and the energy, suggesting that tracks with more energy are less acoustic. Acoustic tracks also seem quieter.
While correlation matrices are useful, they assume a linear relationship between values - unlikely even in our simple dataset. For example, popularity is unlikely to be linearly related to any of the above properties, but we might expect some relationship to exist. They are also only applicable to numeric values and aren’t applicable to categorical variables.
Testing the Null-hypothesis
Hypothesis testing is a fundamental concept in statistics and plays a crucial role in drawing inferences and making decisions. The null hypothesis is used to assess the validity of claims or research hypotheses, using sample data.
Using a subset of the overall data, we state that there is no significant difference in the population being studied. This is usually presented as a statement of equality, stating that two or more groups are equal, or that there is no relationship between variables.
Through a statistical test, we aim to determine whether there is enough evidence in the sample data to reject the null hypothesis in favor of an alternative hypothesis - note, this alternative is not defined.
Student t-tests
To test a hypothesis we can use a student t-test. This allows us to evaluate our null hypothesis that the means of the two populations are equal.
As an example, maybe we state:
The explicit nature of music has no impact on whether it is danceable.
More specifically,
The mean danceability of explicit music is the same as non-explicit music
T-testing makes an assumption the data is approximately normal and the variance is similar. This is particularly important on smaller result sizes (i.e. < 30). However, as shown earlier danceability does appear normal. Our variance is also similar, with a large sample size for our explicit music:
SELECT explicit, varPop(danceability), count() AS c
FROM spotify
GROUP BY explicit

┌─explicit─┬─varPop(danceability)─┬──────c─┐
│ false	│ 0.029643285945200746    │ 104253 │
│ true 	│ 0.029892924927367216    │   9747 │
└──────────┴──────────────────────┴────────┘

2 rows in set. Elapsed: 0.840 sec. Processed 77.00 thousand rows, 8.81 MB (91.69 thousand rows/s., 10.49 MB/s.)
With these properties satisfied, performing a t-test in ClickHouse is simple:
SELECT studentTTest(danceability, explicit)
FROM spotify

┌─studentTTest(danceability, explicit)─┐
│ (-41.67680374902913,0)           	   │
└──────────────────────────────────────┘

1 row in set. Elapsed: 0.841 sec. Processed 2.00 thousand rows, 232.29 KB (2.38 thousand rows/s., 276.13 KB/s.)
The key value here is the 2nd value in our tuple, the p-value. This is the probability of obtaining results as extreme as, or more extreme than, the observed results, assuming the null hypothesis is true.
In our case, our p-value is effectively 0. This means the observed difference between the sample mean of the danceability of explicit and non explicit cannot occur by random chance alone. This means we can reject the null hypothesis that explicit music is unrelated to danceability.
Welch t-tests
The welch t-test provides a similar capability to the standard but allows the variance to differ. Using this we can test the hypothesis:
The explicit nature of music has no impact on its valence.
Valence describes the musical positiveness conveyed by a track.
This is also approximately normally distributed, but with differing variance:
┌─valence─┬─dist─────────────────────────────────────────────────────────────────────────────┐
│   	0 │ █████████████████████▌                                                       	 │
│ 	  0.1 │ █████████████████████████████████████████████████████████▎                   	 │
│ 	  0.2 │ ████████████████████████████████████████████████████████████████████████████▎	 │
│ 	  0.3 │ █████████████████████████████████████████████████████████████████████████████▎   │
│ 	  0.4 │ ████████████████████████████████████████████████████████████████████████████████ │
│ 	  0.5 │ ████████████████████████████████████████████████████████████████████████████▌	 │
│ 	  0.6 │ ████████████████████████████████████████████████████████████████████████▎    	 │
│ 	  0.7 │ ███████████████████████████████████████████████████████████████████▏         	 │
│  	  0.8 │ ████████████████████████████████████████████████████████▉                    	 │
│ 	  0.9 │ ████████████████████████████████████████████▍                                	 │
│   	1 │ ███████████████▍                                                             	 │
└─────────┴──────────────────────────────────────────────────────────────────────────────────┘
SELECT
	explicit,
	varPop(valence),
	count() AS c
FROM spotify
GROUP BY explicit

┌─explicit─┬──────varPop(valence)─┬──────c─┐
│ false	   │  0.06861382619038442 │ 104253 │
│ true 	   │ 0.052252604489216155 │   9747 │
└──────────┴──────────────────────┴────────┘

2 rows in set. Elapsed: 0.857 sec. Processed 2.00 thousand rows, 232.29 KB (2.33 thousand rows/s., 270.96 KB/s.)
Welch's t-test is equally as simple in ClickHouse:
SELECT welchTTest(valence, if(explicit, 1, 0))
FROM spotify

┌─welchTTest(valence, if(explicit, 1, 0))──┐
│ (1.2775135699871494,0.20144516672703286) │
└──────────────────────────────────────────┘

1 row in set. Elapsed: 0.839 sec. Processed 40.00 thousand rows, 4.53 MB (47.65 thousand rows/s., 5.40 MB/s.)
In this case, we fail to reject the hypothesis. We can therefore not state whether explicitness is related to positivity.
Measuring Association
In statistics, the term "association" refers to a relationship or connection between two or more variables in a dataset, providing a measure of how changes in one variable are related to the changes in another. This is crucial in providing insights into the dependencies and patterns within a dataset.
Cramer's V and Theil's U are both measures of association. While Cramer's V measures the association between two categorical variables, Theil's U measures the association between a categorical variable and a nominal or continuous variable. Both these measures are supported in ClickHouse through analytical functions.
Categorical variables refer to variables that take on categories or groups as their values. These can either be nominal (no inherent order or ranking) or ordinal (a natural order or ranking associated with them). In our Spotify dataset, the columns
explicit(explicit lyrics (true = yes it does; false = no or unknown)),track_genre,artistsandkey(The key the track is in. Integers map to pitches using standard Pitch Class notation).popularity, with a value of 0 (not popular) to 100 (popular), andordinalis also an ordinal variable.
Below we compute Cramer's V for these variables against popularity:
SELECT
	cramersV(popularity, explicit),
	cramersV(popularity, key),
	cramersV(popularity, track_genre),
	cramersV(popularity, artists)
FROM spotify

Row 1:
──────
cramersV(popularity, explicit):	0.1111421067814236
cramersV(popularity, key):     	0.049664681157575566
cramersV(popularity, track_genre): 0.16617136848279976
cramersV(popularity, artists): 	0.6256530277850572

1 row in set. Elapsed: 0.843 sec. Processed 51.15 thousand rows, 5.87 MB (60.65 thousand rows/s., 6.96 MB/s.)
Cramer's V ranges from 0 to 1, where 0 indicates no association and 1 indicates a perfect association. Popularity clearly has a strong association with artists as you'd expect.
We'd encourage users to explore other possible associations here. ClickHouse also supports a version of Cramer's V with bias correction (a common challenge of the algorithm if the data is unbalanced or small) - cramersVBiasCorrected. This suggests our associations aren't possibly as strong as we initially measured:
SELECT
	cramersVBiasCorrected(popularity, explicit),
	cramersVBiasCorrected(popularity, key),
	cramersVBiasCorrected(popularity, track_genre),
	cramersVBiasCorrected(popularity, artists)
FROM spotify
FORMAT Vertical

Row 1:
──────
cramersVBiasCorrected(popularity, explicit):	0.10712361030835567
cramersVBiasCorrected(popularity, key):     	0.03986895101010225
cramersVBiasCorrected(popularity, track_genre): 0.1632331461526432
cramersVBiasCorrected(popularity, artists): 	0.34027056010204915

1 row in set. Elapsed: 0.857 sec. Processed 40.00 thousand rows, 4.53 MB (46.67 thousand rows/s., 5.29 MB/s.)
Theil's U is a measure of association that quantifies the amount of information one variable provides about another or more simply how much randomness in a dependent variable can be explained by an independent variable.
Below, we use the APPLY syntax to compute Theil's U for the dependent variable artists and other continuous variables to see if there are obvious associations. We make these continuous variables ordinal, as required by our current implementation of Theil's U:
SELECT * EXCEPT (`Unnamed: 0`, album_name, track_id, artists, track_name, time_signature, track_genre) APPLY x -> theilsU(artists, round(x * 10))
FROM spotify
FORMAT Vertical

Row 1:
──────
theilsU(artists, round(multiply(popularity, 10))):   	-0.3001786653454836
theilsU(artists, round(multiply(duration_ms, 10))):  	-0.9276605586651611
theilsU(artists, round(multiply(explicit, 10))):     	-0.02444367883018377
theilsU(artists, round(multiply(danceability, 10))): 	-0.12620692012945478
theilsU(artists, round(multiply(energy, 10))):       	-0.15039240344091118
theilsU(artists, round(multiply(key, 10))):          	-0.14364542076020673
theilsU(artists, round(multiply(loudness, 10))):     	-0.377285103342597
theilsU(artists, round(multiply(mode, 10))):         	-0.03448619204892218
theilsU(artists, round(multiply(speechiness, 10))):  	-0.07546345974559064
theilsU(artists, round(multiply(acousticness, 10))): 	-0.14720970877815828
theilsU(artists, round(multiply(instrumentalness, 10))): -0.08060433390539239
theilsU(artists, round(multiply(liveness, 10))):     	-0.08880043710056783
theilsU(artists, round(multiply(valence, 10))):      	-0.14408203139969228
theilsU(artists, round(multiply(tempo, 10))):        	-0.524866311749112

1 row in set. Elapsed: 0.991 sec. Processed 114.00 thousand rows, 13.05 MB (115.01 thousand rows/s., 13.17 MB/s.)
It's important to note that Theil's U is asymmetric, meaning that theilsU(X, Y) is not necessarily equal to theilsU(Y, X).
Some of the associations above seem intuitive. We would expect most artists to have a similar tempo in their music and the artist influences the popularity of the track. Surprisingly, artists also write songs of similar length.
Simplifying with UDFs
Our previous examples were simplified by the Hugging Face dataset having only one Parquet file. For those datasets with more than a single file, we can list and use many files as suffix choices in a pattern. For example, our initial blog_authorship_corpus dataset consists of 3 files.
https://huggingface.co/datasets/blog_authorship_corpus/resolve/refs%2Fconvert%2Fparquet/blog_authorship_corpus/train/0000.parquet
https://huggingface.co/datasets/blog_authorship_corpus/resolve/refs%2Fconvert%2Fparquet/blog_authorship_corpus/train/0001.parquet
https://huggingface.co/datasets/blog_authorship_corpus/resolve/refs%2Fconvert%2Fparquet/blog_authorship_corpus/validation/0000.parquet
With a URL pattern, we can capture these 3 files with the pattern:
https://huggingface.co/datasets/blog_authorship_corpus/resolve/refs%2Fconvert%2Fparquet/blog_authorship_corpus/{train/0000,train/0001,validation/0000}.parquet
Our url function accepts this pattern, allowing us to query multiple files at once.
SELECT count() FROM url('https://huggingface.co/datasets/blog_authorship_corpus/resolve/refs%2Fconvert%2Fparquet/blog_authorship_corpus/{train/0000,train/0001,validation/0000}.parquet')
While possible, this feels impractical for larger file listings. Below, we encapsulate this logic in a user defined function (UDF), to which the user only has to pass a dataset name. This relies on the predictable url format noted earlier for Hugging Face hosted Parquet files.
We start by producing a function which outputs a list of the files for a specific dataset name.
CREATE OR REPLACE FUNCTION hugging_paths AS dataset -> (
	SELECT arrayMap(x -> (x.1), JSONExtract(json, 'parquet_files', 'Array(Tuple(url String))'))
	FROM url('https://datasets-server.huggingface.co/parquet?dataset=' || dataset, 'JSONAsString')
)

SELECT hugging_paths('blog_authorship_corpus') AS paths FORMAT Vertical

Row 1:
──────
paths: ['https://huggingface.co/datasets/blog_authorship_corpus/resolve/refs%2Fconvert%2Fparquet/blog_authorship_corpus/train/0000.parquet','https://huggingface.co/datasets/blog_authorship_corpus/resolve/refs%2Fconvert%2Fparquet/blog_authorship_corpus/train/0001.parquet','https://huggingface.co/datasets/blog_authorship_corpus/resolve/refs%2Fconvert%2Fparquet/blog_authorship_corpus/validation/0000.parquet']

1 row in set. Elapsed: 1.540 sec.
We can take this a little further using string functions to create a UDF which calls the above function, outputting a pattern which captures all of the files for the dataset.
CREATE OR REPLACE FUNCTION hf AS dataset -> (
	WITH hugging_paths(dataset) as urls
	SELECT multiIf(length(urls) = 0, '', length(urls) = 1, urls[1], 'https://huggingface.co/datasets/{' || arrayStringConcat(arrayMap(x -> replaceRegexpOne(replaceOne(x, 'https://huggingface.co/datasets/', ''), '\\.parquet$', ''), urls), ',') || '}.parquet')
)

SELECT hf('blog_authorship_corpus') AS pattern
FORMAT Vertical

Row 1:
──────
pattern: https://huggingface.co/datasets/{blog_authorship_corpus/resolve/refs%2Fconvert%2Fparquet/blog_authorship_corpus/train/0000,blog_authorship_corpus/resolve/refs%2Fconvert%2Fparquet/blog_authorship_corpus/train/0001,blog_authorship_corpus/resolve/refs%2Fconvert%2Fparquet/blog_authorship_corpus/validation/0000}.parquet

1 row in set. Elapsed: 1.633 sec.
With this simple function, we can query any Hugging Face dataset using just its name by simply invoking it as the parameter of the url function.
SELECT count() AS c,
	artists
FROM url(hf('maharshipandya/spotify-tracks-dataset'))
GROUP BY artists
ORDER BY c DESC
LIMIT 5

┌───c─┬─artists─────────┐
│ 279 │ The Beatles 	│
│ 271 │ George Jones	│
│ 236 │ Stevie Wonder   │
│ 224 │ Linkin Park 	│
│ 222 │ Ella Fitzgerald │
└─────┴─────────────────┘

5 rows in set. Elapsed: 2.917 sec. Processed 2.00 thousand rows, 232.62 KB (686.25 rows/s., 79.74 KB/s.)
While the invocation of the Hugging Face API, and parsing of the response, adds some overhead to our query, this should be negligible on queries for larger datasets dominated by the downloading and querying of files.
The above can be simplified further using the url table engine. Below we create a table abstraction for the dataset.
CREATE TABLE spotify AS url(hf('maharshipandya/spotify-tracks-dataset'))

SELECT count() AS c, artists
FROM spotify
GROUP BY artists
ORDER BY c DESC
LIMIT 5

┌───c─┬─artists─────────┐
│ 279 │ The Beatles 	│
│ 271 │ George Jones	│
│ 236 │ Stevie Wonder   │
│ 224 │ Linkin Park 	│
│ 222 │ Ella Fitzgerald │
└─────┴─────────────────┘

5 rows in set. Elapsed: 1.367 sec. Processed 114.00 thousand rows, 13.05 MB (83.39 thousand rows/s., 9.55 MB/s.)
Accelerating queries with local tables
All of the previous queries relied on using the url function to download the Parquet file on each innovation. While this could be accelerated for common queries by simply downloading the file to the local filesystem and using the file function, thus avoiding the HTTP overhead for each query, performance will still be bounded by the Parquet format. Alternatively, if querying a dataset more frequently, users may want to create a local table within a clickhouse-local session and insert the data. This table can then be queried directly, delivering significantly improved performance.
This table differs from the previous example powered by the url table engine. In this case we insert the data into ClickHouse’s own internal format. The previous example was still backed by the Parquet file.
When defining a table, an engine must be defined. Users have two main choices here - MergeTree or Memory. The former, while requiring the definition of an ordering key, will provide the most optimal performance on most queries and will not be bounded by memory for larger datasets. Below we insert the Spotify dataset into a table and repeat our earlier simple query.
–-allow_nullable_key allows us to use track_genre for key
–- this creates the table and inserts the data in a single query
CREATE TABLE spotify_merge
ENGINE = MergeTree
ORDER BY track_genre
SETTINGS allow_nullable_key = 1 AS
SELECT *
FROM url(hf('maharshipandya/spotify-tracks-dataset'))

0 rows in set. Elapsed: 3.038 sec. Processed 114.00 thousand rows, 13.05 MB (37.52 thousand rows/s., 4.30 MB/s.)

SELECT count() AS c, artists
FROM spotify_merge
GROUP BY artists
ORDER BY c DESC
LIMIT 5

┌───c─┬─artists─────────┐
│ 279 │ The Beatles 	│
│ 271 │ George Jones	│
│ 236 │ Stevie Wonder   │
│ 224 │ Linkin Park 	│
│ 222 │ Ella Fitzgerald │
└─────┴─────────────────┘

5 rows in set. Elapsed: 0.016 sec.
As well being almost 100 times faster than the url function, note how our schema is automatically inferred from the Parquet file when the table is created. With this usage pattern, users can exploit the full capabilities of the ClickHouse MergeTree which powers real-time analytical applications at PB scale.
We use the ordering key
track_genreabove. Users looking for optimal performance on larger datasets, or needing to optimize for specific access patterns, should consider this key carefully. Further information here.
Choosing the usage pattern here depends on how frequently users expect to query a Hugging Face dataset. For infrequent, ad-hoc queries we recommend the url function and UDF. If you expect to query frequently, creating a table and inserting the data will deliver faster queries and reduce iteration cycles as you explore the data.
Conclusion
In this blog post we’ve explored how clickhouse-local can be used to query Hugging Face datasets directly using the url function. We have performed some simple queries on a Spotify dataset and illustrated how a basic statistical analysis can be performed without writing any code and using just SQL. For larger datasets, users can leverage these statistical tests and still enjoy the performance of ClickHouse from their laptop or workstation. Finally, we’ve provided a simple UDF that readers can use to query a Hugging Face dataset by only its name and shown how datasets can be inserted into local tables for optimal performance.