Introduction
Many of the blog topics at ClickHouse are initiated by community engagement through mediums such as our public Slack channel. With the recent announcement of our official Kafka Connector and its support in Confluent Cloud, we’ve had folks reaching out to ask about how to measure and mitigate latency when dealing with Kafka and transferring data to ClickHouse Cloud. That’s a good conversation to have and formulated our response in a blog post - let’s discuss!
How does the Kafka Connector work?
First things first, let’s remind everyone about how the connection between Kafka and ClickHouse works (and where our connector fits in). An example data flow might look like this:
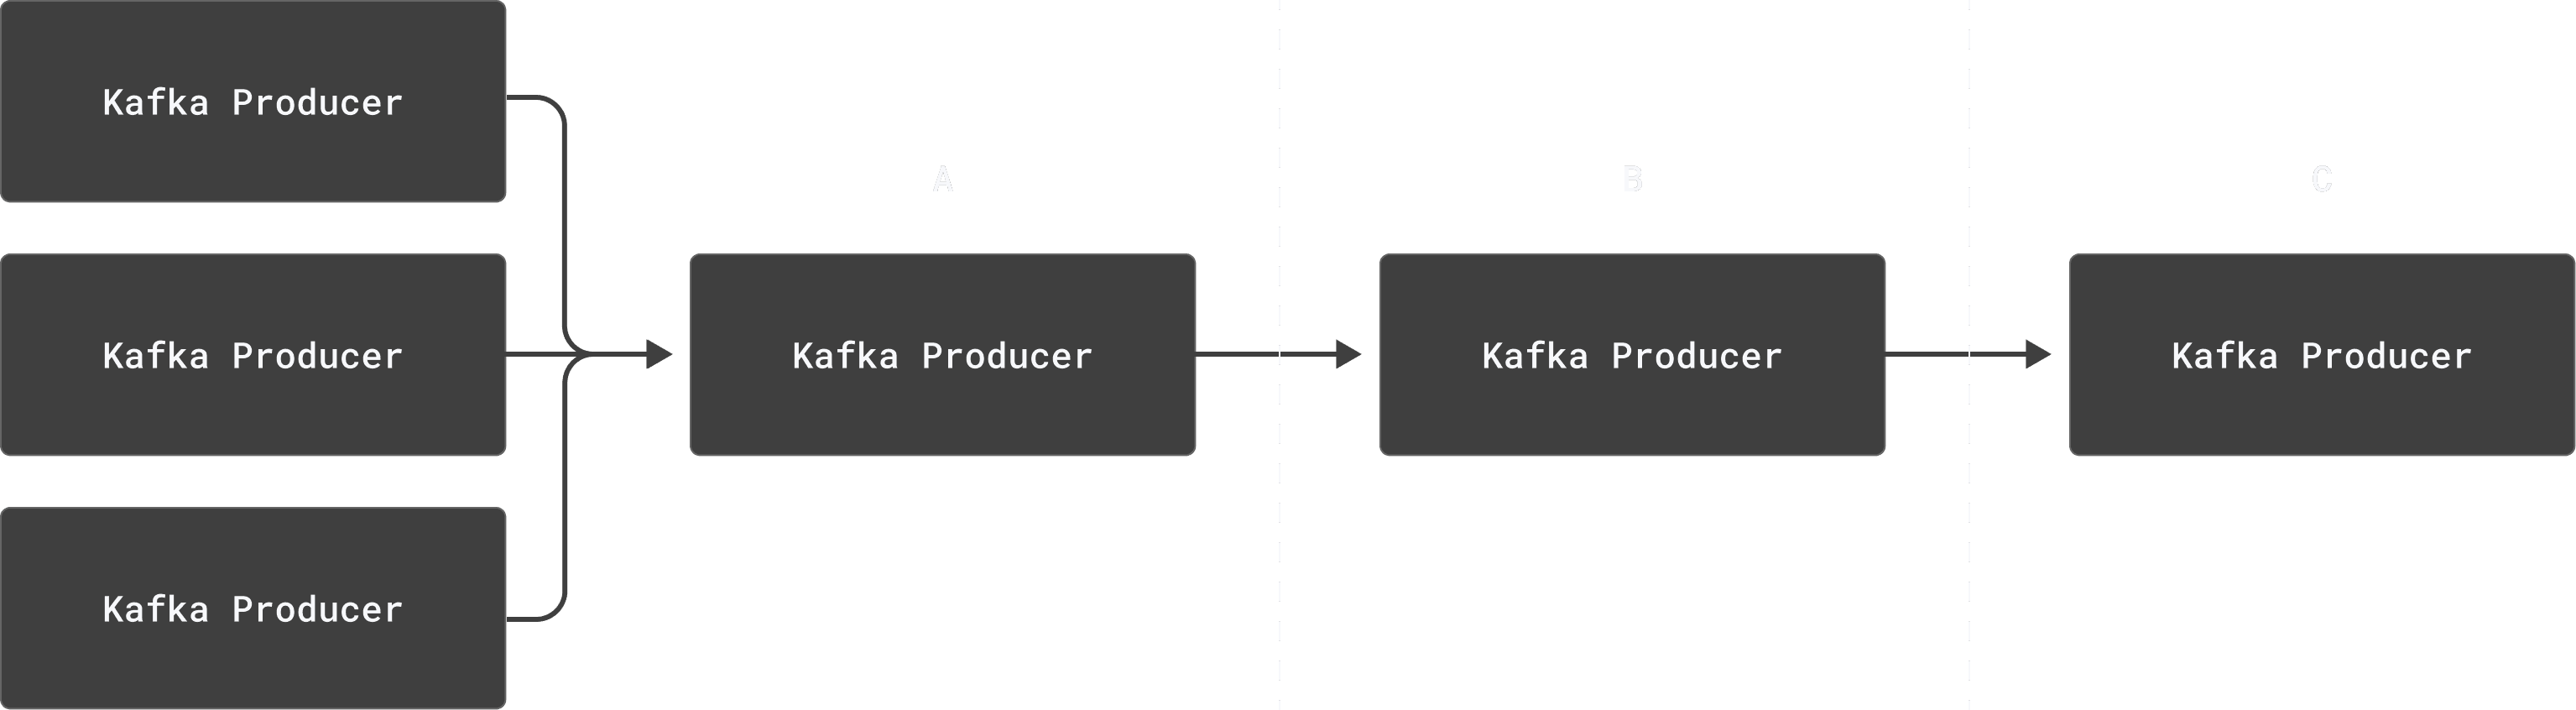
In essence, producers submit data to topics (A), which are fetched and then sent by “Kafka Connect” to the connector through polling (B), which pushes the records to ClickHouse (C). In the above diagram, A is separate from B, and B is separate from C - all three are distinct systems, with network connections between them.
Implementations can vary of course, but we’ll work with the broadest setup for now so that it covers the most cases - if your setup doesn’t have a component mentioned, feel free to ignore that part.
What is Latency?
This all may be obvious but it bears repeating: latency (in this context) is the time data takes to travel from Point A to Point B. It’s caused by several factors, the most common being: hardware, software, and the network.
Hardware factors are usually physical limitations that contribute to latency - VM sizing, processor speeds, etc. We defer these to the reader to resolve and focus on variables controllable by the Connector itself.
Software factors are usually more design limitations than physical issues - number of threads, data structure, configuration settings, etc. They’re also especially common and what most of this guide will be focusing on.
Network factors are usually the physical network between nodes, virtual connections between virtual machines, distance from client to server, etc.
When is latency an issue?
Before we get into the how of latency, it’s important to briefly talk about when and why: “Why should I care about latency? When is latency an issue?”
You’re the expert on your use case, but we would caution you about setting unrealistic expectations around latency - it’s easy to be overly fixated on small differences in latency, which are unlikely to have a significant business impact, such that even a second or two deviation results in alarms. Please keep in mind that in a network distributed environment there will be some amount of latency - the task is more about mitigating/stabilizing it where and when possible, rather than eliminating it entirely. Ideally, you are able to establish what is an acceptable latency and ensure this is maintained within defined bounds - possibly with an SLA.
Similarly, one use case may tolerate far more latency than another use case - if you’re doing analysis on data once a week, that may allow for far more latency than real-time analytics. Even for real-time analytics, what “real-time” means is something you have to decide - again, you’re the expert on your use case; just keep in mind there are going to be hardware/software/network limitations.
How do I measure latency?
In order to identify whether you have a latency problem in your Kafka pipeline, you need to be able to measure it.
The simplest approach is to append timestamp values to messages at various points of the Kafka pipeline. These can later be compared, and visualized, to indicate possible steps causing latency.
One really effective way we’ve seen to achieve this1 is by using single message transformers:
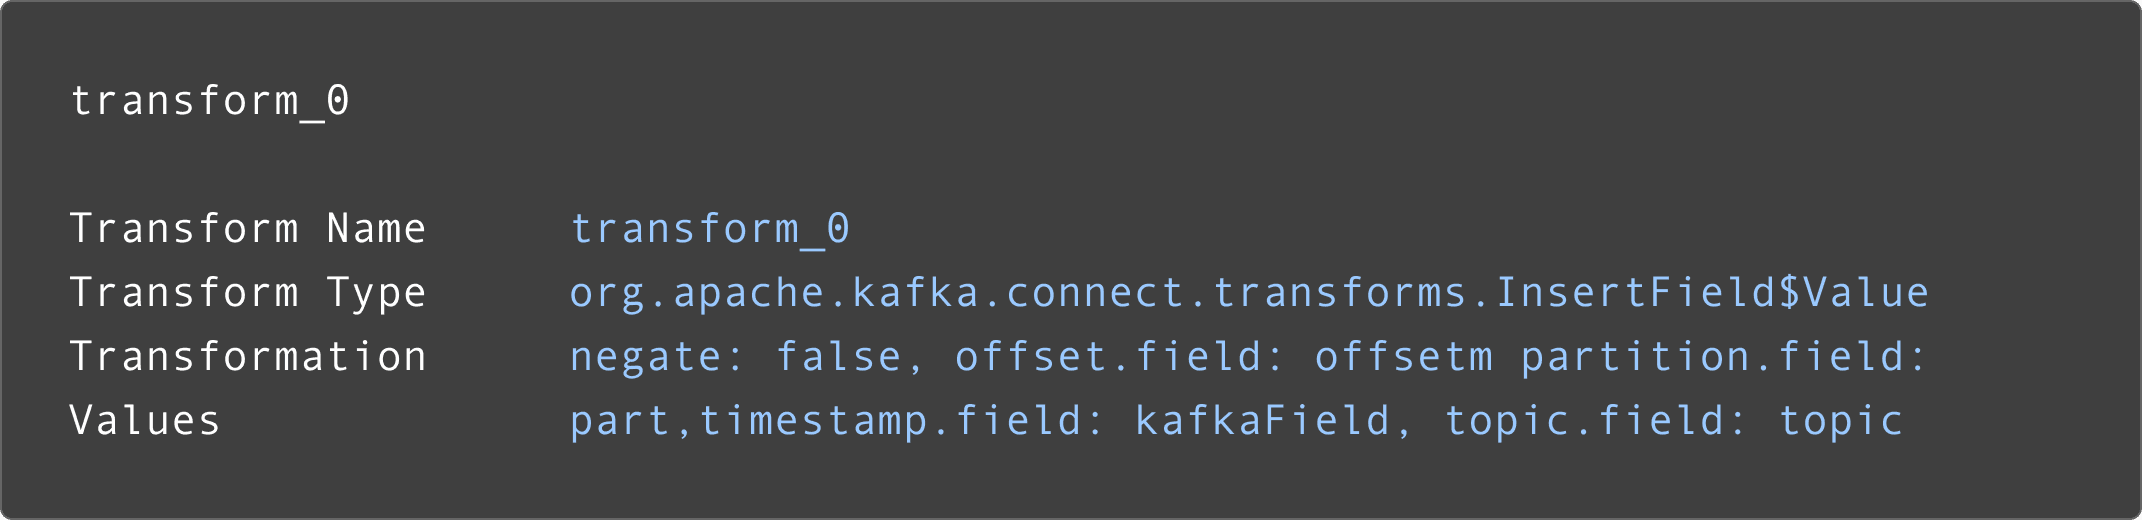
1 There’s multiple options available, for example JMX, but we found SMT to be good enough - YMMV
This transform takes several out-of-the-box fields (Offset, Partition, Timestamp, and Topic) and adds them into the object for the connector to pass on to ClickHouse, without having to change the message producers. This transformer can be configured to run at various steps, allowing users to attribute latency to specific parts of a processing pipeline.
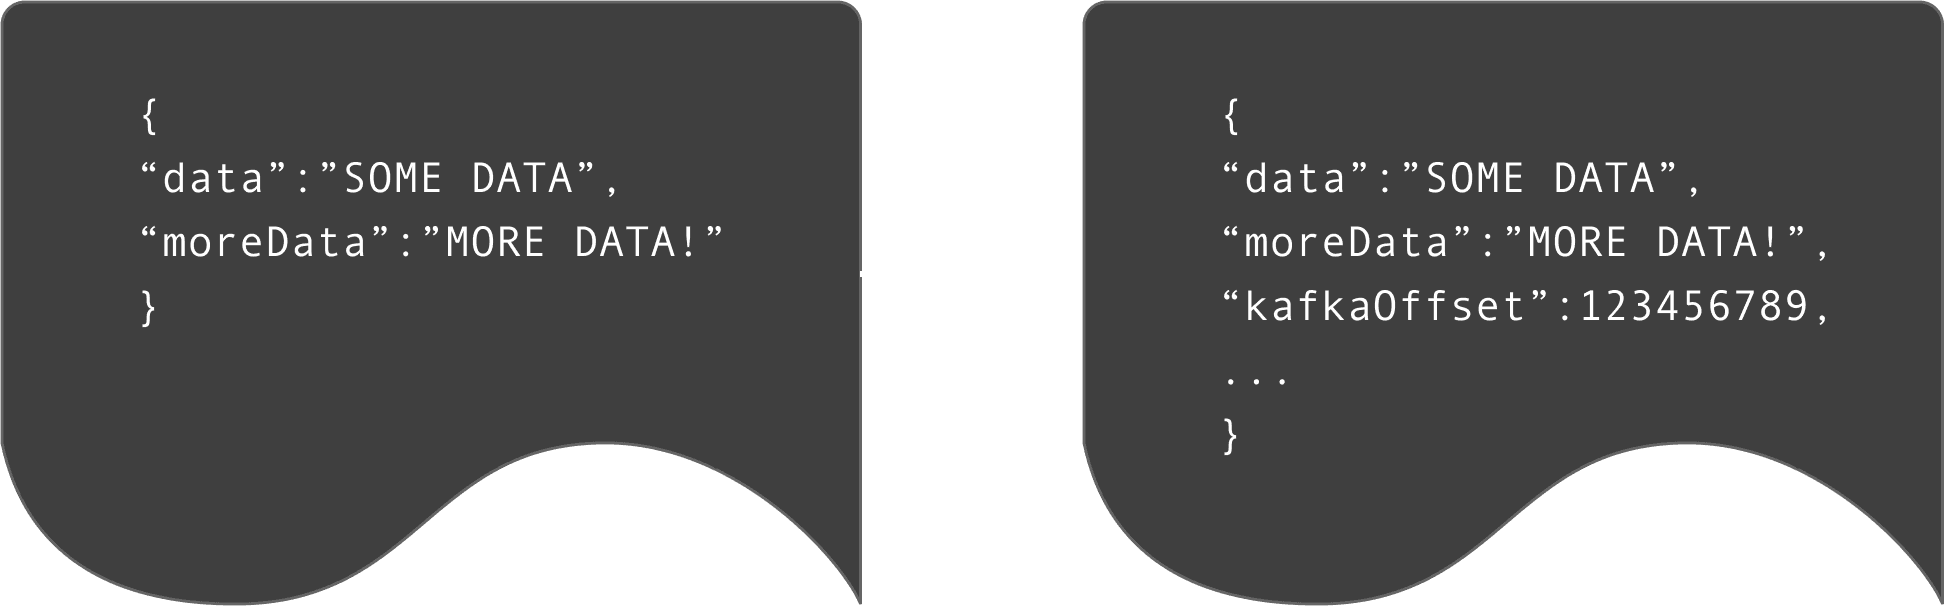
The above transform allows us to identify timings at different stages of the Kafka pipeline. We can also record the exact point at which a message was inserted into ClickHouse as a row. This can be achieved using an insert timestamp via a DEFAULT expression, which can then be compared with earlier timings added by transforms:
CREATE TABLE data_testing
(
  `raw` String,
  `generationTimestamp` DateTime64(3),
  `insertTime` DateTime64(3) DEFAULT now()
)
ENGINE = MergeTree
ORDER BY insertTime
Notice that we’re using “DEFAULT now()” so that the time is generated by ClickHouse and not present in the message itself - this will give us the insert time.
If your messages have a generation timestamp, you could also track the time between: Message Generation <-> Kafka Insert <-> ClickHouse Insert.
How do I visualize latency?
One common way to visualize latency is to use the built-in tables ClickHouse SQL Console (on ClickHouse Cloud) provides:
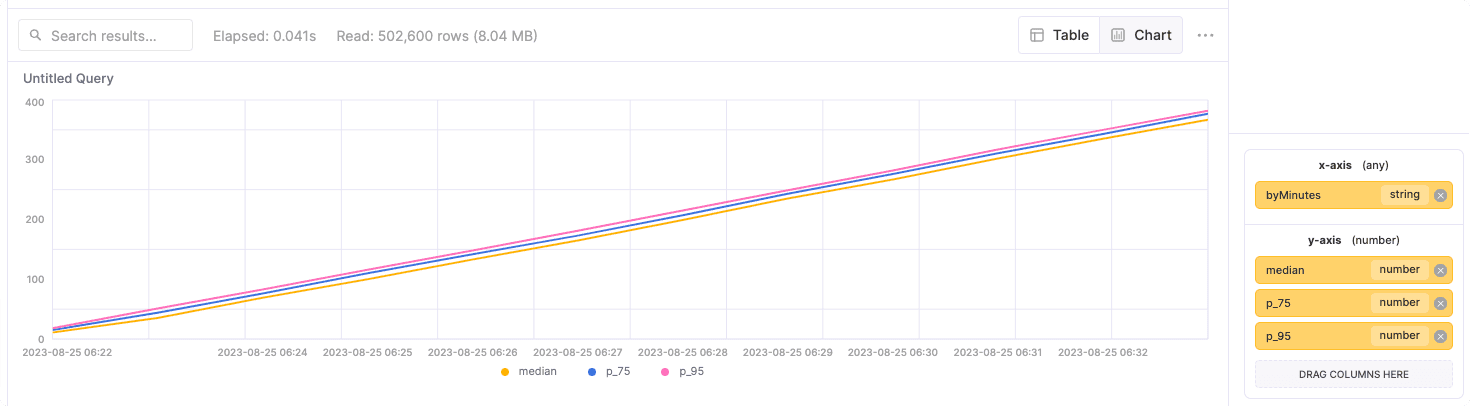
The data for this chart was created using a fairly simple query to calculate median, 75th percentile, and 99th percentile:
SELECT formatDateTime(insertTime, '%F %k:%i') as byMinutes,
    median(dateDiff('second', generationTimestamp, insertTime)) AS median,
    median(.75)(dateDiff('second', generationTimestamp, insertTime)) AS p_75,
    median(.95)(dateDiff('second', generationTimestamp, insertTime)) AS p_95
FROM default.kafka_data
WHERE insertTime > now() - interval 60 MINUTE
GROUP BY byMinutes
ORDER BY byMinutes ASCENDING
InsertTime is provided by a default column (mentioned earlier using “now()”) while generationTimestamp is a column we set when generating the data - you could just as easily use something like kafkaField (mentioned earlier that was created by a transform).
Note: The data in the example chart shows a slowly increasing latency time and just seeing this would be enough to indicate a possible issue - the power of a visual!
How do I deal with latency?
We’re going to cover a few ways to address latency, but keep in mind that this list isn’t exhaustive - you may find other methods work better. If you do, please let us know - the more information, the better we can help others!
Latency can occur in multiple parts of the system. We address potential causes at each stage below.
Latency between Kafka and Kafka Connect
Fetch and Batch Size
Records are fetched by Kafka Connect independently of the connector, and you can tweak this by setting consumer.fetch.min.bytes and consumer.fetch.max.bytes. As you can imagine, there’s a balancing act here - ideally, you’re fetching more records than the batch size so that you always have enough to fill a batch. You can even tweak how often fetching happens by setting consumer.fetch.max.wait.ms - it might take longer, but the fetch is more likely to hit the maximum size (and so optimize how many connections need to be made) if you find you’re not generating messages all that often.
Similarly, on the other side, the batches the connector receives are controlled by polling (the default is 500):
consumer.max.poll.records=[NUMBER OF RECORDS]
consumer.max.partition.fetch.bytes=[NUMBER OF RECORDS * RECORD SIZE IN BYTES]
Different Kafka Connect hosts are going to have different ways to handle adjusting - see Confluent’s documentation for their preferred method, for example.
Number of Partitions
The number of topic partitions can affect the volume of inserts and batch sizes (which can increase network chattiness, as you might imagine). One hundred messages spread out across one hundred partitions is going to have more of an impact than a single partition, especially based on the numbers of tasks/workers running. Since the above poll and fetch process is performed per task (see below), more partitions may increase the time to fill a batch (if following recommendations below of one task per partition) - potentially increasing latency. We generally thus recommend leaning towards fewer partitions (within reason) rather than more, but there’s not a set rule for sizing this.
We generally recommend inserting data in fairly large batches of at least 1,000 rows at a time, and ideally between 10,000 to 100,000 rows (See our best practices for more information).
Number of Tasks
In Kafka Connect, tasks are the workers that actually copy the data - we’ve seen recommendations that you have at least as many tasks as partitions, to ensure each “channel” flows properly.
If you’d like to dig deeper into Tasks, check out the Confluent doc on the topic.
Too Many Parts
Something that we’ve run into are “Too Many Parts” errors - ClickHouse is optimized for large volumes of data (properly batched) rather than frequent smaller inserts (the classic “chatty” vs “batchy” network debate). Inserts are handled on a per task basis - each task is responsible for inserting that task’s data into ClickHouse - so more partitions/tasks isn’t always better.
Latency between Kafka Connect and ClickHouse Cloud
Instance Sleeping
ClickHouse Cloud will put instances to sleep (to save you credits) when the service is not subject to queries. This means that when there are gaps in insert and query activity, the instance may be paused. If there is, in turn, an influx of new data, it will likely create a delay as the instance is spun back up.
If this latency is unacceptable, users can tune the idling timeout for a service to the workload - increasing it so that shorter periods of inactivity do not result in idling.
Instance Sizing
More data is going to require more capacity - though ClickHouse is very efficient, this general adage still applies. ClickHouse Cloud will generally handle scaling for you - see our documentation for more details.
Asynchronous vs Synchronous Inserts
By default, our connector sends data through synchronous inserts - waiting for a confirmation before continuing. This is generally safer from a data-loss perspective, but it does introduce some level of latency as each insert requires confirmation of success.
Asynchronous inserts, on the other hand, can be configured to just submit data and move on without waiting - potentially improving throughput. If potential lost messages aren't a concern (for instance, you’re doing consumer analytics and need a more general amount of data rather than specific entries) this may be a faster method. Note that this method means lower durability guarantees, delivering at best at least once semantics.
See our documentation for more details on configuring this.
Conclusion
In this post, we have described latency, which can be an issue in Kafka and ClickHouse architectures. As well as identifying causes of latency and approaches to minimize it, we have first suggested a simple means to measure and visualize it.
We hope this helps you on your ClickHouse journey - more to come!