We're excited to share this guest post from Grupo Masmovil, one of Spain's largest telecommunications operators. Rodrigo Aguirregabiria Herrero, a Senior Monitoring Engineer from Masmovil's OSS & Tools Monitoring department, details the challenges of monitoring Radio Access Networks (RAN) and how ClickHouse has transformed their approach.
For those who are not familiar with Radio Access Networks (RAN), they are the first point of access to mobile networks. These nodes allow your smartphone to access 2G, 3G, 4G and 5G networks.
These networks are large and require thousands of nodes (or antennas) to be deployed. This way, when you move away from one node, you can connect to another one and maintain your internet connection.
In MasMovil we decided to migrate from Telecom-specific tools to open source technologies for BigData, one of these is ClickHouse which has allowed us to:
- Improve our monitoring solutions:
- Having more reliable solutions
- Speeding our processing times
- Keeping more data
- Save costs in:
- Software Licenses
- 3rd level supports
- Hardware
Let’s see how we’ve done it.
The Actual Size of the Data
So, how can we monitor the thousands of nodes that provide internet services to millions of people?
There are several ways to do this, but in this case, we will focus on the information that comes directly from those nodes.
These nodes have many metrics to monitor almost every aspect of their performance, such as connection to other nodes, number of calls, traffic, and literally thousands of counters per node.
We don’t need all that information, so we filter it. However, we still have hundreds of counters and thousands of nodes, all publishing data every 15 minutes.
Data comes into our servers in an unstructured format, stored in files written on disk. Therefore, it is not published as event streaming. These files have a size that can be between 200kb and 40 MB (that’s a wide range indeed), but nodes with 40 MB are only a small portion. The most common case is nodes around 2-5 MB, imagine we only have around 10.000 nodes, we’ll be dealing with around 30 GB every 15 minutes, almost 3TB of data per day. Note: 10k nodes are not enough to offer service to the whole of Spain.
Basically we need to process thousands of files every hour, but the main problem was to read the files written on disk fast enough. Processing data is not too complicated with streaming tools. Nevertheless, we need a database that is optimal in terms of disk usage.
This is one of the benefits of ClickHouse., along with really fast-speed queries.
With ClickHouse, you can use different codecs and compression algorithms, which is helpful in this case, as tuning compression results in significantly reduced storage burden, which is not only more efficient but more cost-effective as well.
Let’s look at the data compression we achieved with ClickHouse in one of our tables:
| rows | disk_size | compressed_size | uncompressed_size | ratio |
| 562426183 | 351.84 GiB | 349.04 GiB | 1.31 TiB | 0.260 |
The compression is quite good, and we use much less disk compared to the actual size of the data and compared to the solution we had previously.
With our current solution, we’re using 16x times less disk usage than our previous, but most importantly, we’re keeping more data. How is that possible? First, we need to understand a little bit about formulas, legacy telecom monitoring systems, and temporal and physical aggregation.
Formulas, Temporal, and Spatial Aggregation
Earlier in this article, we’ve talked about counters; however, in almost all cases, counters alone don’t provide much helpful information. The valuable information comes from the formulas designed by our Engineering teams or the vendor of the nodes.
These formulas produce KPIs that can use one or multiple counters (and by several, I mean many; we have formulas with over 150 counters).
So, if we have hundreds of counters that are not useful and hundreds of useful KPIs, why not keep only the calculated KPIs? It could be a solution, but not a valid one, because we don’t only monitor the nodes and a certain period, users need information in different time aggregations and spatial ones.
Users find useful data in batches of 15 minutes, hourly, daily etc. and this information cannot come pre-calculated, because that will lead to false KPIs in bigger temporal aggregations.
A quick example the success rate of calls in a node, the formula would be:
100 x (Successful Calls/ Call Attempts)
And one node in one hour:
| Time | Successful Calls | Call Attempts | Success Call Rate |
| 9:00 | 1 | 1 | 100% |
| 9:15 | 2 | 2 | 100% |
| 9:30 | 100 | 300 | 33,33% |
| 9:45 | 98 | 100 | 98% |
If we only got the final KPI, we could not get the real value of the hours, because let see if we get the AVG -> (100 + 100 + 33, 33 + 98)/4 = 82,83
But that value is completely tergiversated. It does not take into account that in some timestamps the number of calls was way bigger.
The real KPI would be calculated with:
100 * ((1+2+100+98)/(1+2+300+100)) = 49,88
Which is almost the half of the estimated using the average. This means that we need the information of all the counters, not the final KPI.
This kind of calculations are quite easy using SQL, just transforming the time to the previous hours, and summing the counter, for this example:
toStartOfHour(Time), 100 * SUM(Successful Calls)/SUM(Call Attempts)
Quite easy! And the best we do not need the calculated KPIs.
The problem with our legacy system is that it needs both the calculated KPIs and the raw counters, so as a result we consume more disk space.
We’ve talked about time aggregation, but there is also the spatial aggregation. We’ve only mentioned the monitoring of the nodes, but inside those nodes there are cells and above them, there is topology information about the city, region, and the values of certain KPIs in the whole country, which are key to our engineering teams.
In terms of special aggregation, we’ll have:
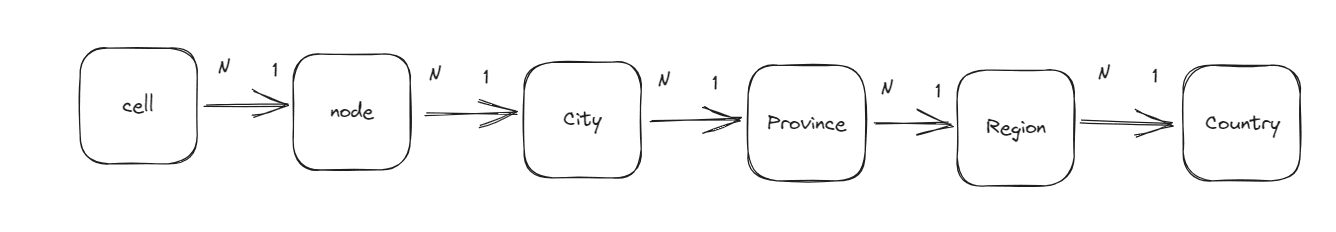
One node contains a set of cells, and a node belongs to a city, a region, etc. Users need the ability to do all the necessary drill downs.
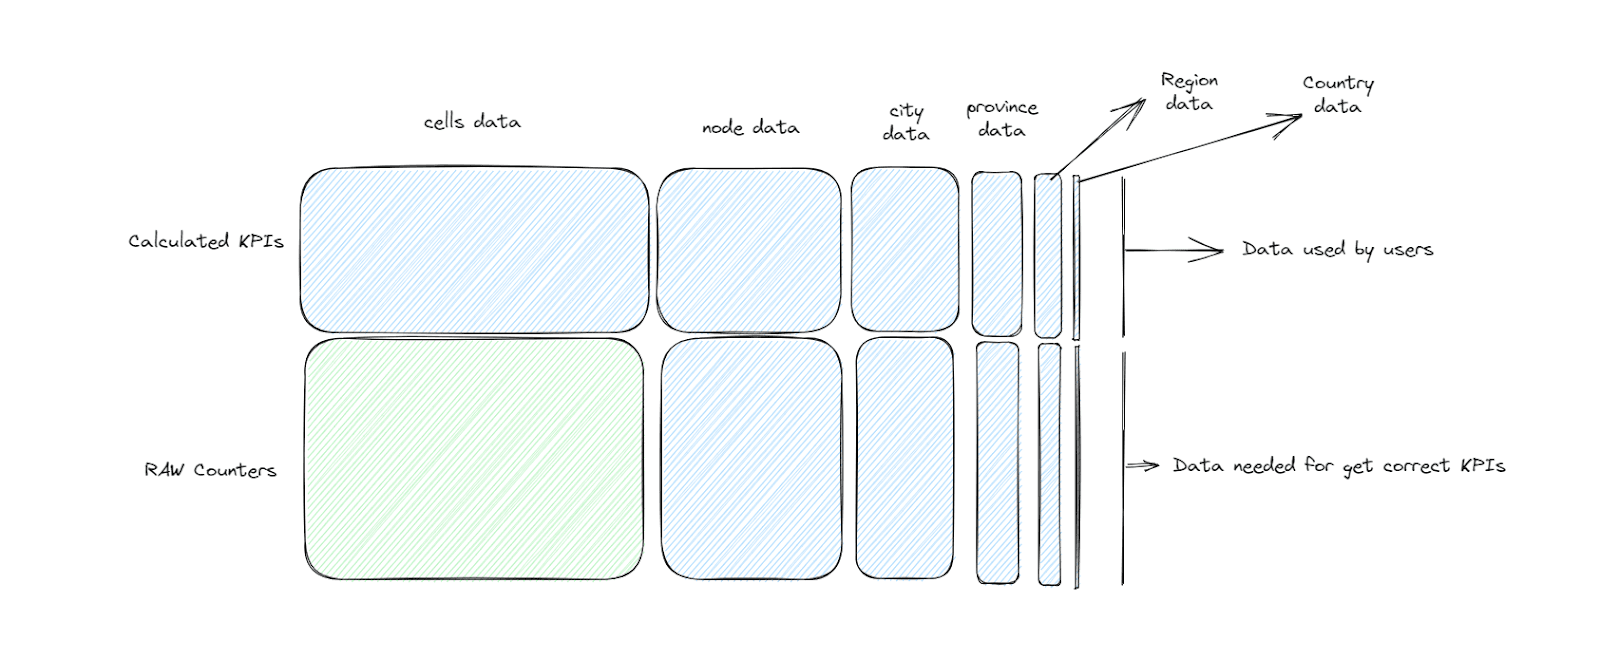
The problem is that the legacy system requires both the raw counters and the calculated KPIs for all the spatial and temporal aggregations.
An image of the actual data required by legacy systems would look like this:
But we’re not considering the temporal aggregations, so we’ll have a third dimension, a cube. A cube in data sounds a lot like an OLAP cube, right?
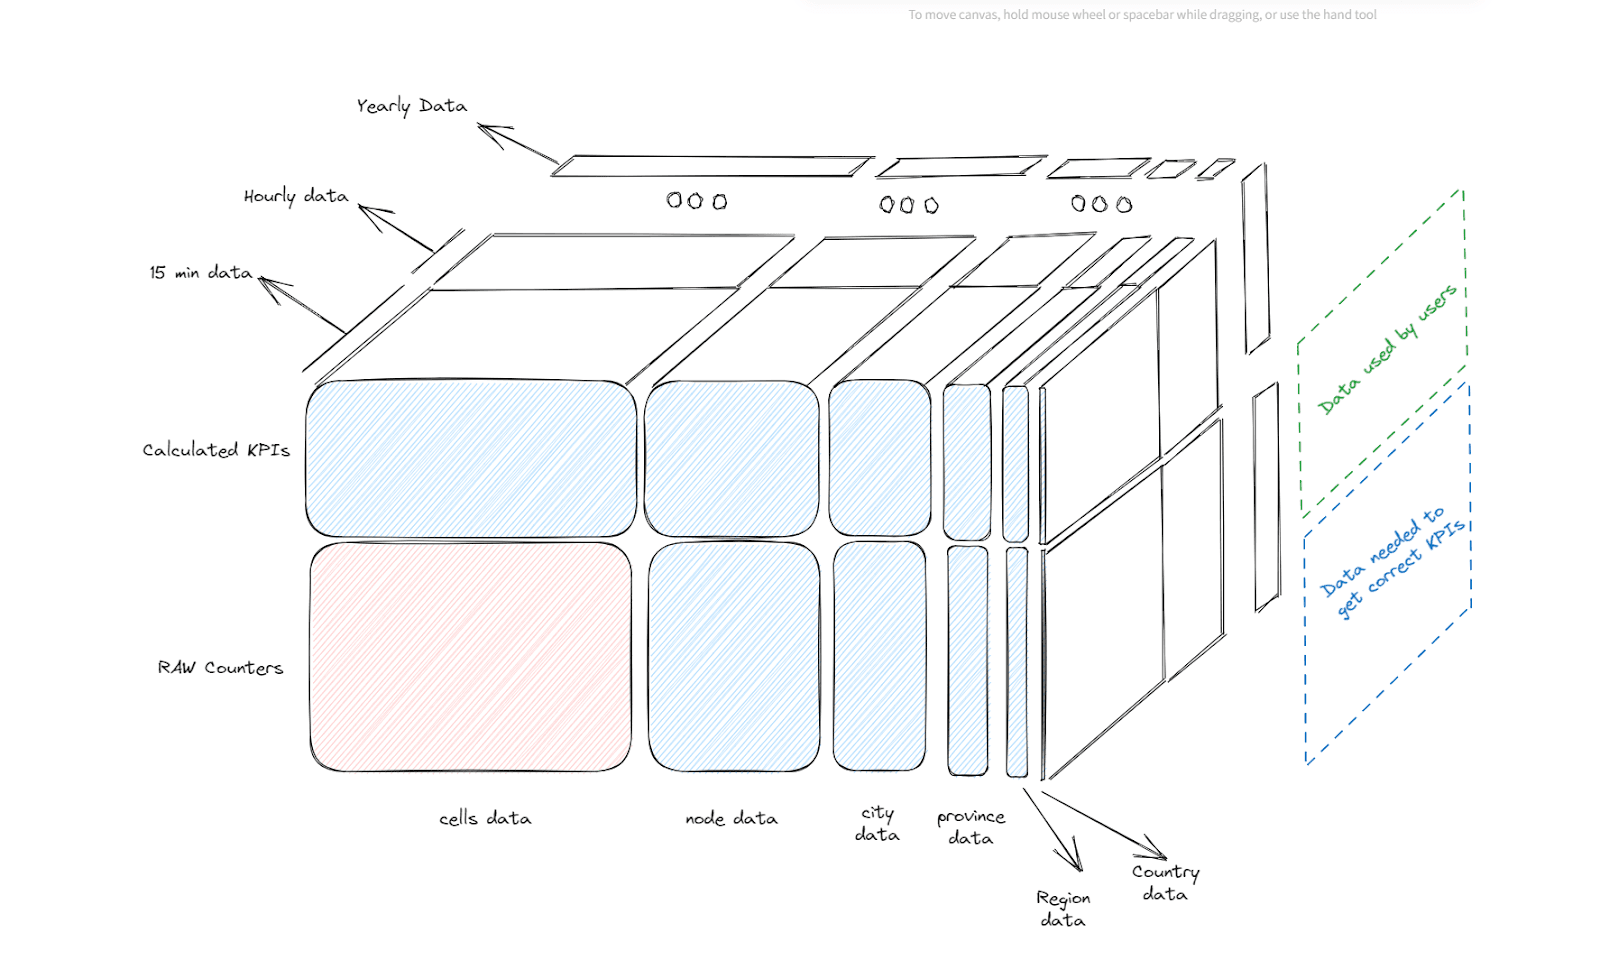
We are exponentially increasing the size of the data. And in the legacy system, we had complicated ways to create these formulas and aggregations, having internal inventories for both KPIs and the network topology.
But consider this, if we had a high-speed OLAP database we would only need the raw counters for cells tagged (adding columns) with the rest of the topology, just like this:
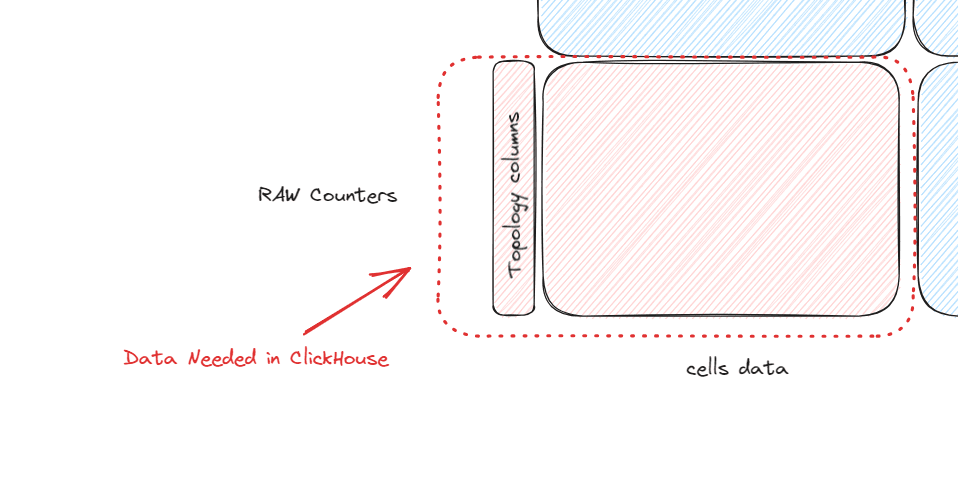
And this is the main reason why we use ClickHouse. Real-time queries are so fast in ClickHouse, that we no longer need a complex system to calculate formulas for different types of aggregation. At the moment we have the cell data, enriched with topology, we have all the information above it, no second process in the background waiting for more data.
Also, the legacy system needed to store a lot of data on disk, it could not store much data of the minimum time aggregations. For instance, for 15-minute data, we only had 15 days, 30 days for hourly data, and a year of 15-minute data.
Right now, we have 1 year of 15-minute data. More is not needed and for larger aggregations, we keep them in separate tables. In the end, we have a much richer set of data and we’re using 16 times less disk space.
SQL, Power to the Queries
Another important aspect is the formulas. They are very different from each other, some are easy, some use hundreds of counters, some need the value of the same KPI in its previous time, some counters are arrays, etc.
This adds a lot of complexity to some formulas. If you need a system that offers you these functionalities, you’ll need a complex system that can continuously deliver improvements if some new kind of KPI arrives. These kinds of systems not only require a powerful database but also a powerful backend. With all this complexity, another problem comes along, the delay in the publication of the metrics, our legacy system could be publishing data with a 3-hour delay.
But with SQL and the added functionality that ClickHouse brings we could replicate all the different KPIs, having some fun creating them ourselves or with the help of the ClickHouse support team, which helped us a lot with special and weird KPIs.
With SQL we can use the same formula for all kinds of aggregation and in our case, we use Grafana to represent it Using the variables and the queries, we enable the user to switch easily between temporal and spatial aggregations and everything is dynamic.
So ClickHouse combines both our backend and the database.
About our ClickHouse Environment
We deployed ClickHouse with docker in a virtual machine that runs in an ESX.
We started with a couple of cores and 8GB of RAM, adding more resources as they were needed.
Most of the time it consumes a couple of cores, but it can take all the cores to give the user the result as soon as possible.
Results and Conclusions
After a year and a half of implementing this new way of monitoring RAN networks, these are the results:
- We keep more data, using 16 times less space.
- Users can look at older data with no lost information.
- Results are published with much less delay (15 minutes vs 3 hours of legacy system). The main delay is in the extraction of the data files.
- We use 10 times less resources (CPU and memory)
- Formulas of KPIs are transparent to the user, and no longer hidden from the user backends.
- Support multiple visualization tools:
- Superset
- Grafana
- Custom front-end developments
- Stability. Our ClickHouse deployment has never failed and has not been down, the legacy system usually got gaps and needed constant restarts.