Since the initial release of the ClickHouse plugin for Grafana in May 2022, both technologies have matured significantly. In a recent blog post, we described how the maturity of real-time OLAP stores combined with open-source standardization enables the application of SQL to the observability use case. Fundamental to this vision is Grafana and its “open tent” philosophy which allows users to explore and visualize Observability data through ClickHouse. Appreciating one of the challenges of using SQL for Observability is learning and adopting SQL, we have continued to invest in the ClickHouse plugin to assist with this.
The release of version 4, sees a new philosophy to user interaction where logs and traces become first class citizens in a new query builder experience. We believe this should minimize the need for SREs to write SQL queries and simplify SQL-based Observability, moving the needle forward for this emerging paradigm.
In this blog post, we explore how the user experience has evolved in version 4.0 and the thinking behind our design decisions. Part of this has been to place Open Telemetry (OTel) at the core of the plugin as we believe this will be the foundation of SQL-based Observability over the coming years and how data will be collected.
OpenTelemetry as a first-class citizen
Earlier versions of the ClickHouse Grafana plugin attempted to provide a data-agnostic experience, allowing users to build visualizations on top of any data type. While this capability is preserved in version 4, users will find the experience far more opinionated and focused on delivering a smooth experience for Observability datasets: Grafana’s primary use case.
This change will be immediately apparent when the plugin is first installed and the user is required to configure a datasource. In addition to being able to configure a default database (and now also table) users can specify a configuration for their logs and trace data. In its simplest form, this means specifying just a default database and table for the logs and/or traces data. However, you can also specify that your data conforms to the OTel specification (and the specific version you are using). If you’ve made changes to the default OTel schemas, or prefer to use your own format, column names can be overridden.
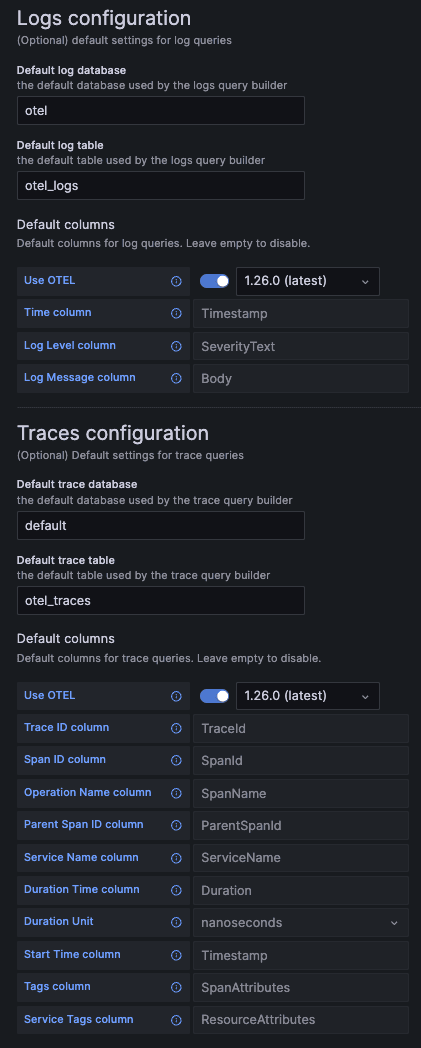
The Logs configuration is quite simple here - a time, log level, and message column are required in order for logs to be rendered nicely as we’ll see in a moment.
The Traces configuration is slightly more complex. The required columns here are needed such that subsequent queries, which build a full trace profile, can be abstracted. These queries assume data is structured similarly to OTel, so users deviating significantly from the standard schema will need to use views to benefit from this feature.
A simpler experience
Earlier versions of the plugin aimed to assist with the user building a SQL query, agnostic of the type of data being queried. This required the user to specify whether they wanted to build a query which would select rows, perform an aggregation, or perform a time series analysis. This selection was made through the poorly named “Show As” options of Table, Aggregate, and Time Series. As well as controlling the query builder options itself, with the aim of helping the user avoid typing SQL for the target query type, this option confusingly also controlled the rendering of the data in initial versions. Later iterations separated this, via the “Format” option. While this allowed users to build a query type and render it how they needed e.g. time series as a table, it was ultimately confusing. It led to users reverting to the SQL Editor where queries could be entered manually.
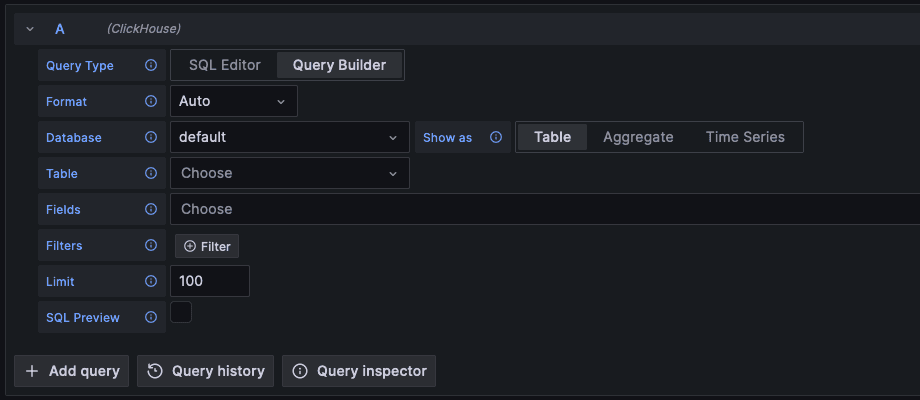 version 3
We wanted to address this confusion in version 4 as a priority. Additionally, wanting to provide a more Observability-focused experience we have introduced dedicated query builders for Logs and Traces. These are available through a new “Query Type” selector, which simply controls the layout of the builder. Appreciating users will need to still build generic time series queries and aggregations, this includes a Table and Time Series options. Finally, for those users who have advanced queries, we retain the ability to write your own queries through the classic SQL Editor.
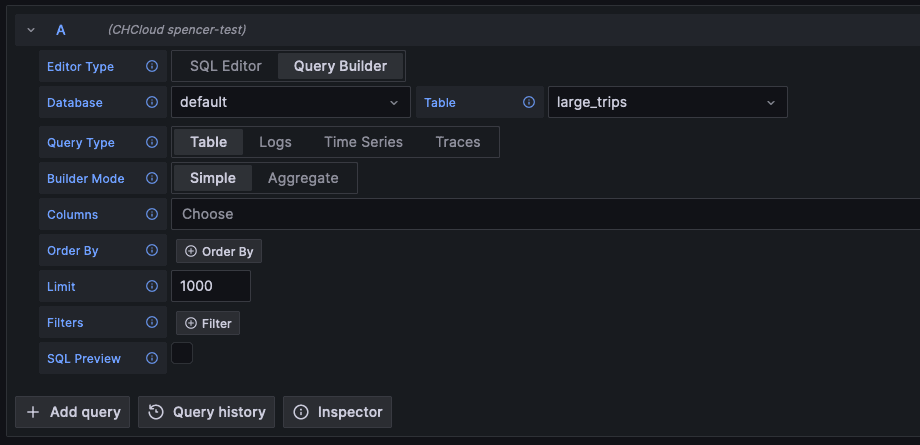 version 4
Querying traces
Grafana offers a rich ability to query and render traces. This requires the target store to reconstruct an entire trace, based on its id, with its constituent spans. In ClickHouse SQL, this invariably leads to a complex query for which users would historically abstract away with parameterized views. The overall experience would remain unsatisfactory, however, with users needing to query the view through the SQL editor.
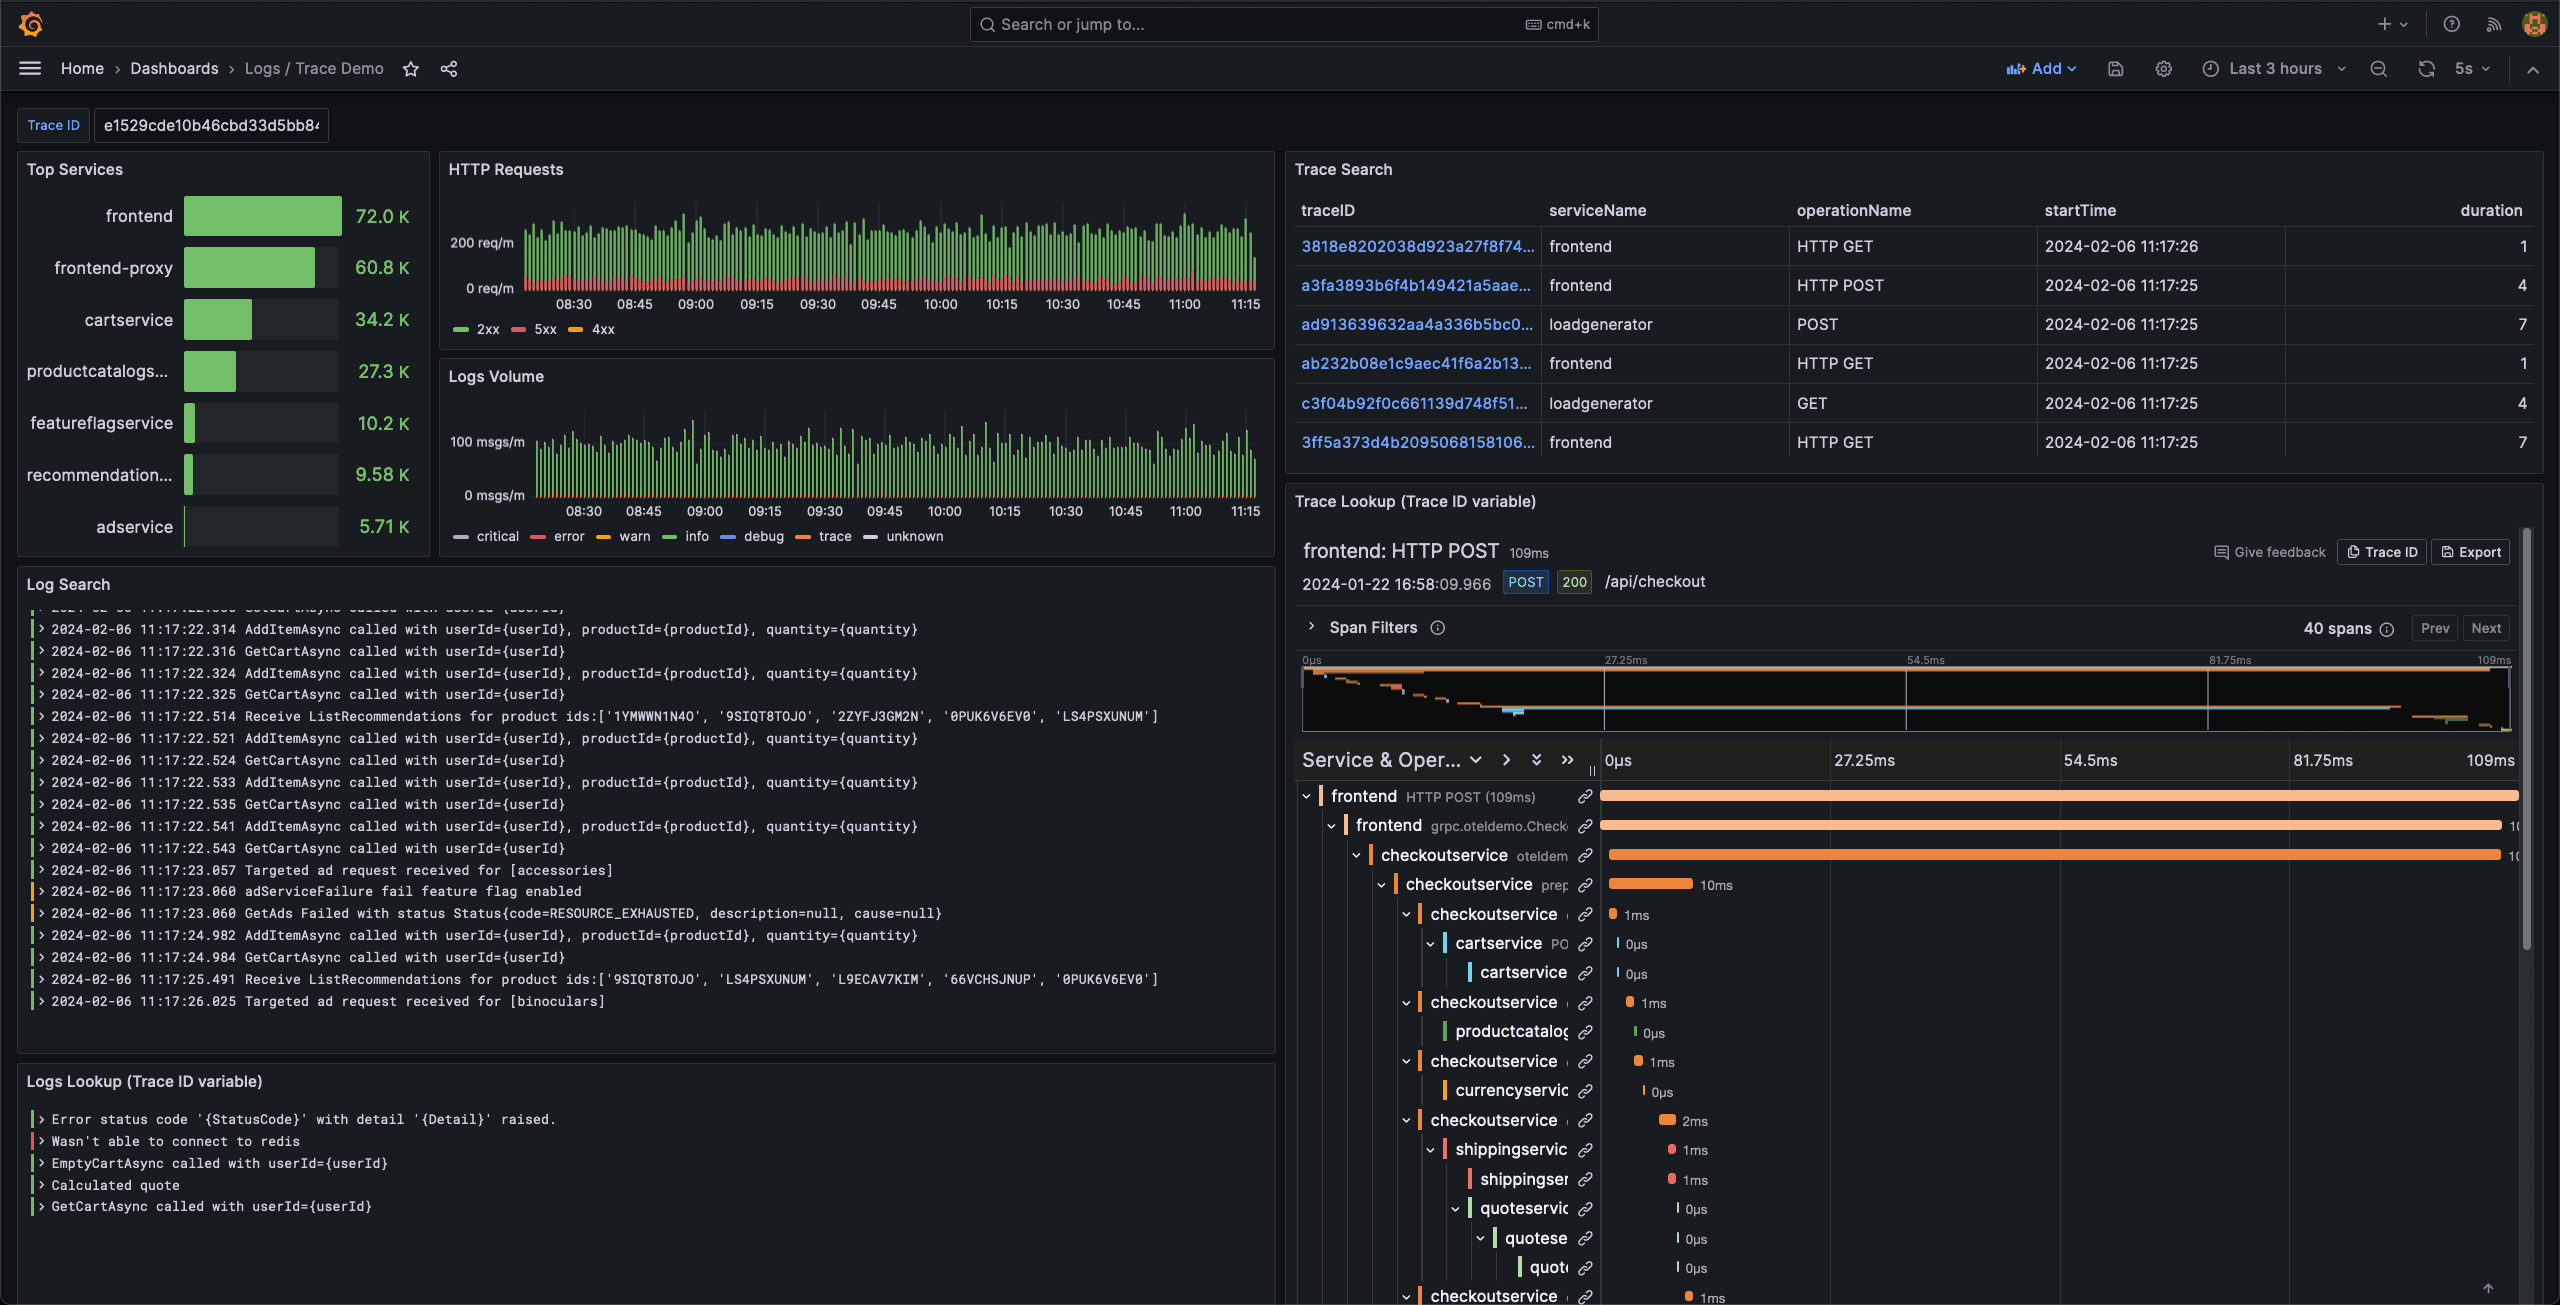
In 4.0, users can simply search for traces using filters e.g. to limit results to those exceeding an SLA duration. The required query to identify top-level traces is automatically generated for the user, with results returned in a table format as shown. This requires users to specify columns which map to required concepts, such as TraceId. Fortunately, for those users using an OTel schema these mappings are automatically populated.
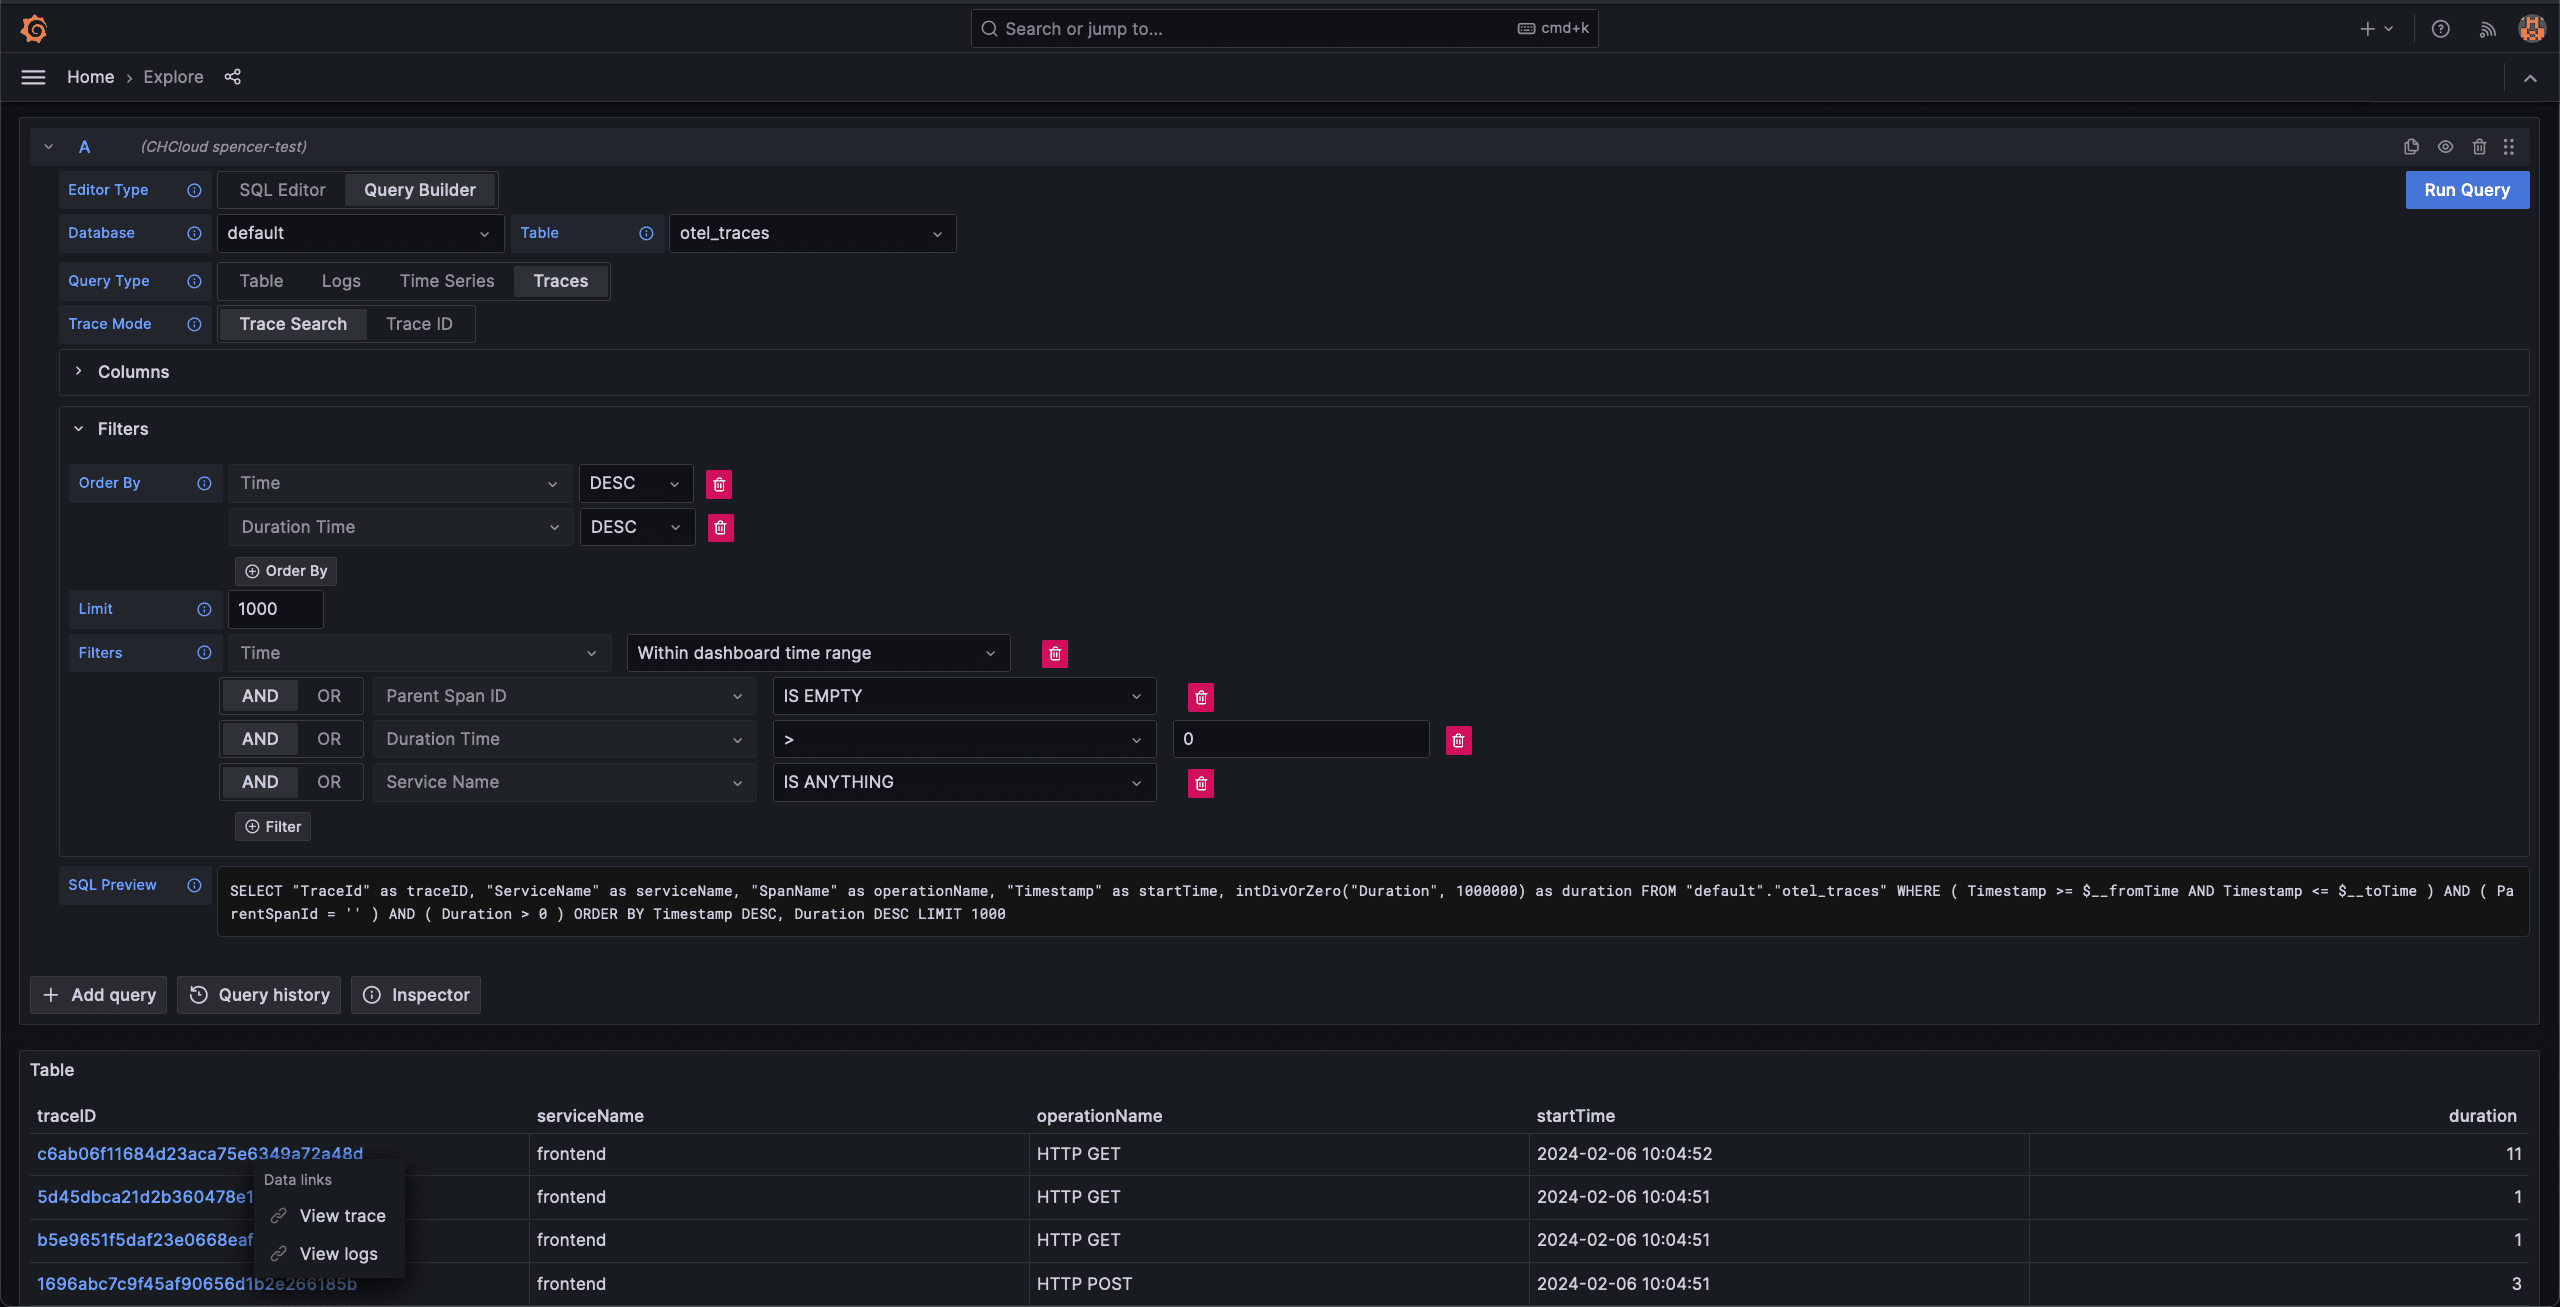
Notice how the above includes both the ability to drill into a trace and retrieve the associated logs. The latter of these capabilities is fundamental to providing a unified Observability experience, with the user able to navigate between different data types effortlessly.
The "View trace" link allows a trace’s spans to be retrieved in the required format for Grafana so that it can be rendered as a waterfall in the right side of a split view.
Should users wish to examine a specific trace and its spans, searching by id is now also supported. Again no SQL-required, simply enter the id and search. This specific application flow is intended for those users identifying traces of interest from other Observability sources e.g. logs.
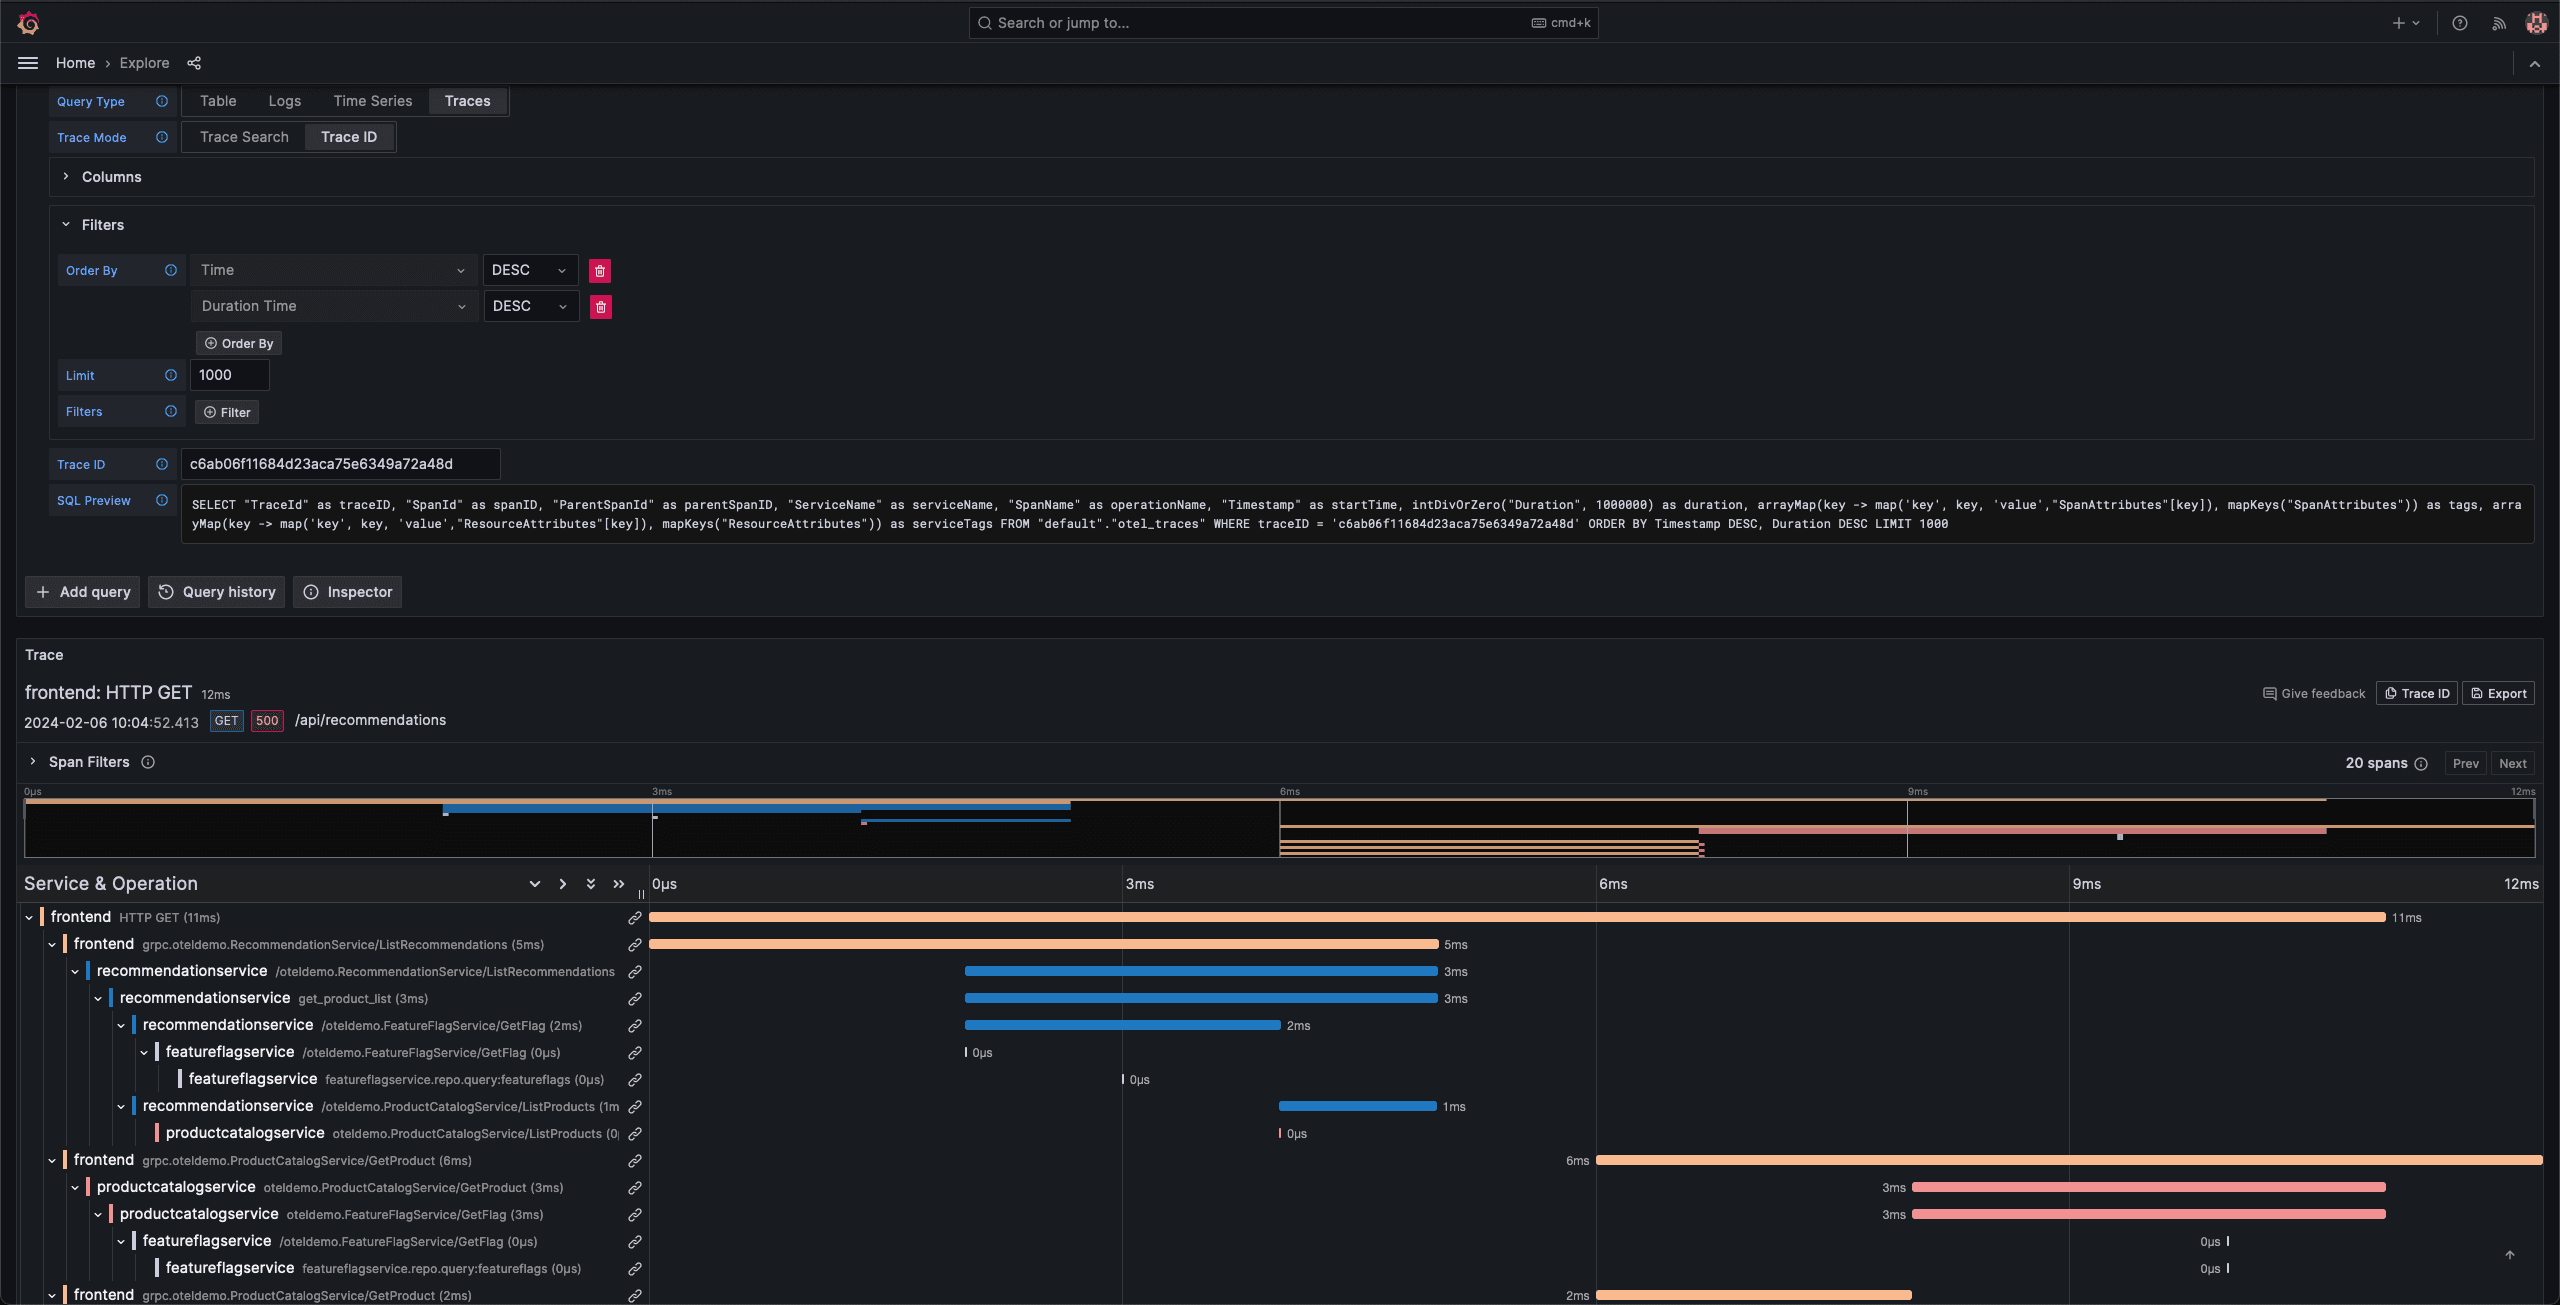
These simple means of searching and rendering traces without needing to write queries, allows non SQL practitioners to potentially enjoy ClickHouse’s high compression rates and lightning retrieval times.
Querying logs
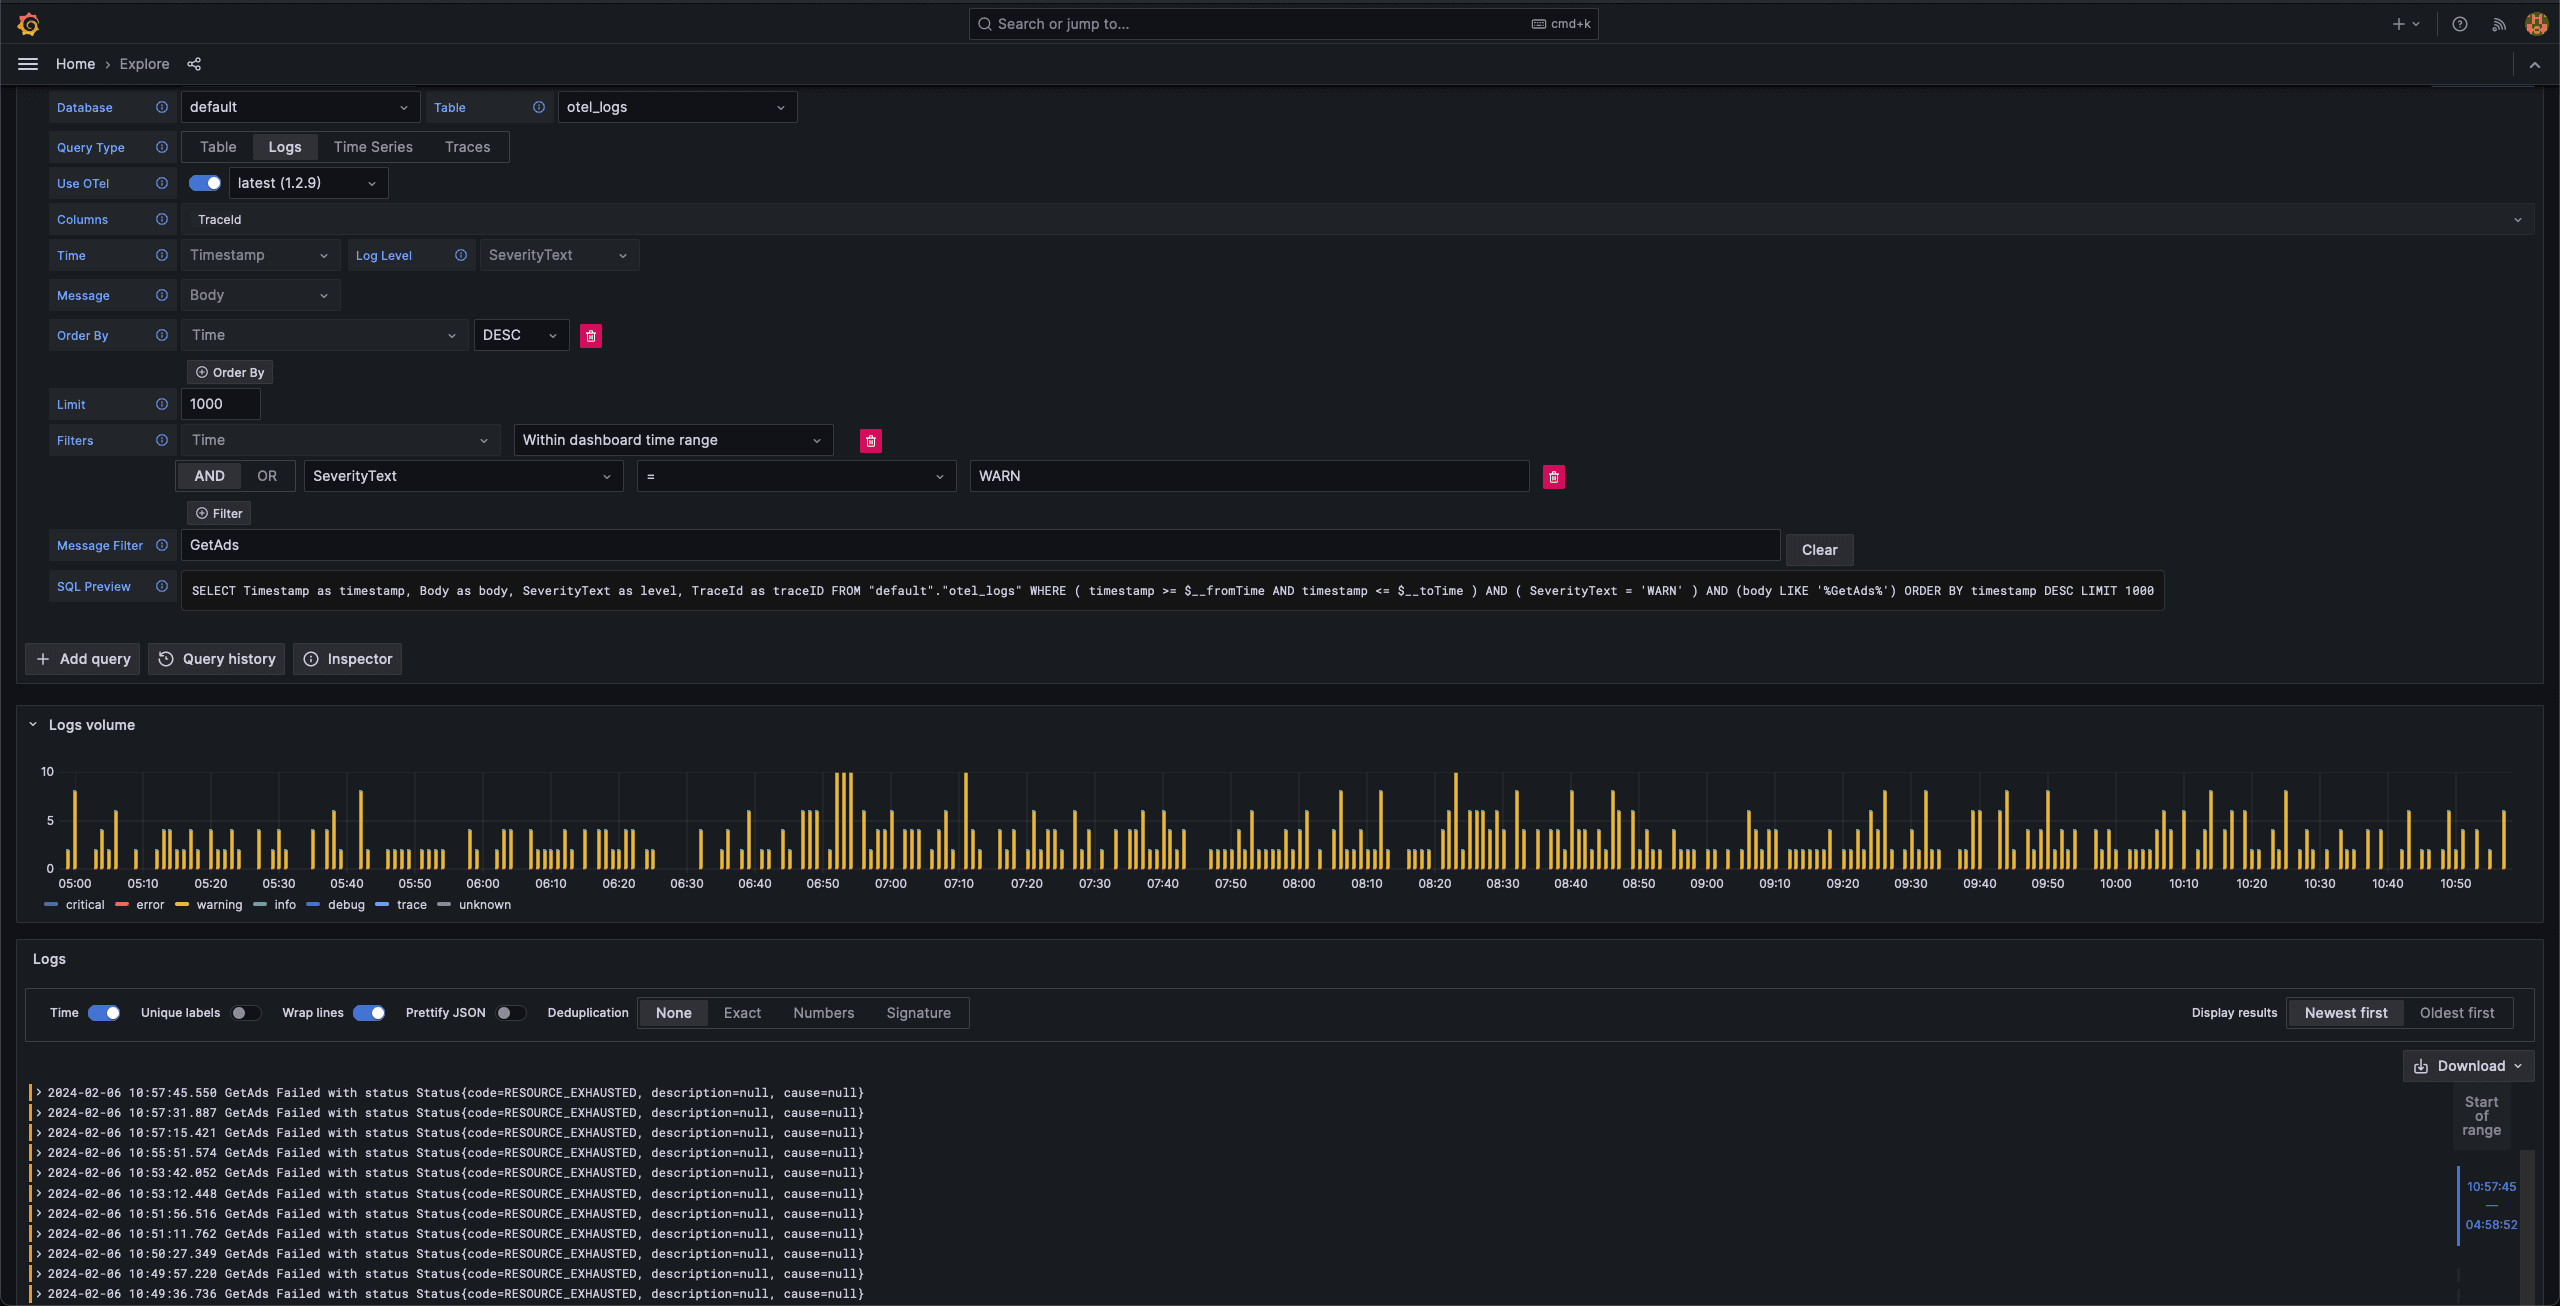
The Logs query builder is predominantly designed for use with Grafana’s Explore view, where users can list log events and perform drill-downs. Assuming you’re using OTel, querying log data now shouldn’t require anything more than selecting Logs for your Query Type, adjusting the time period and clicking Run Query.
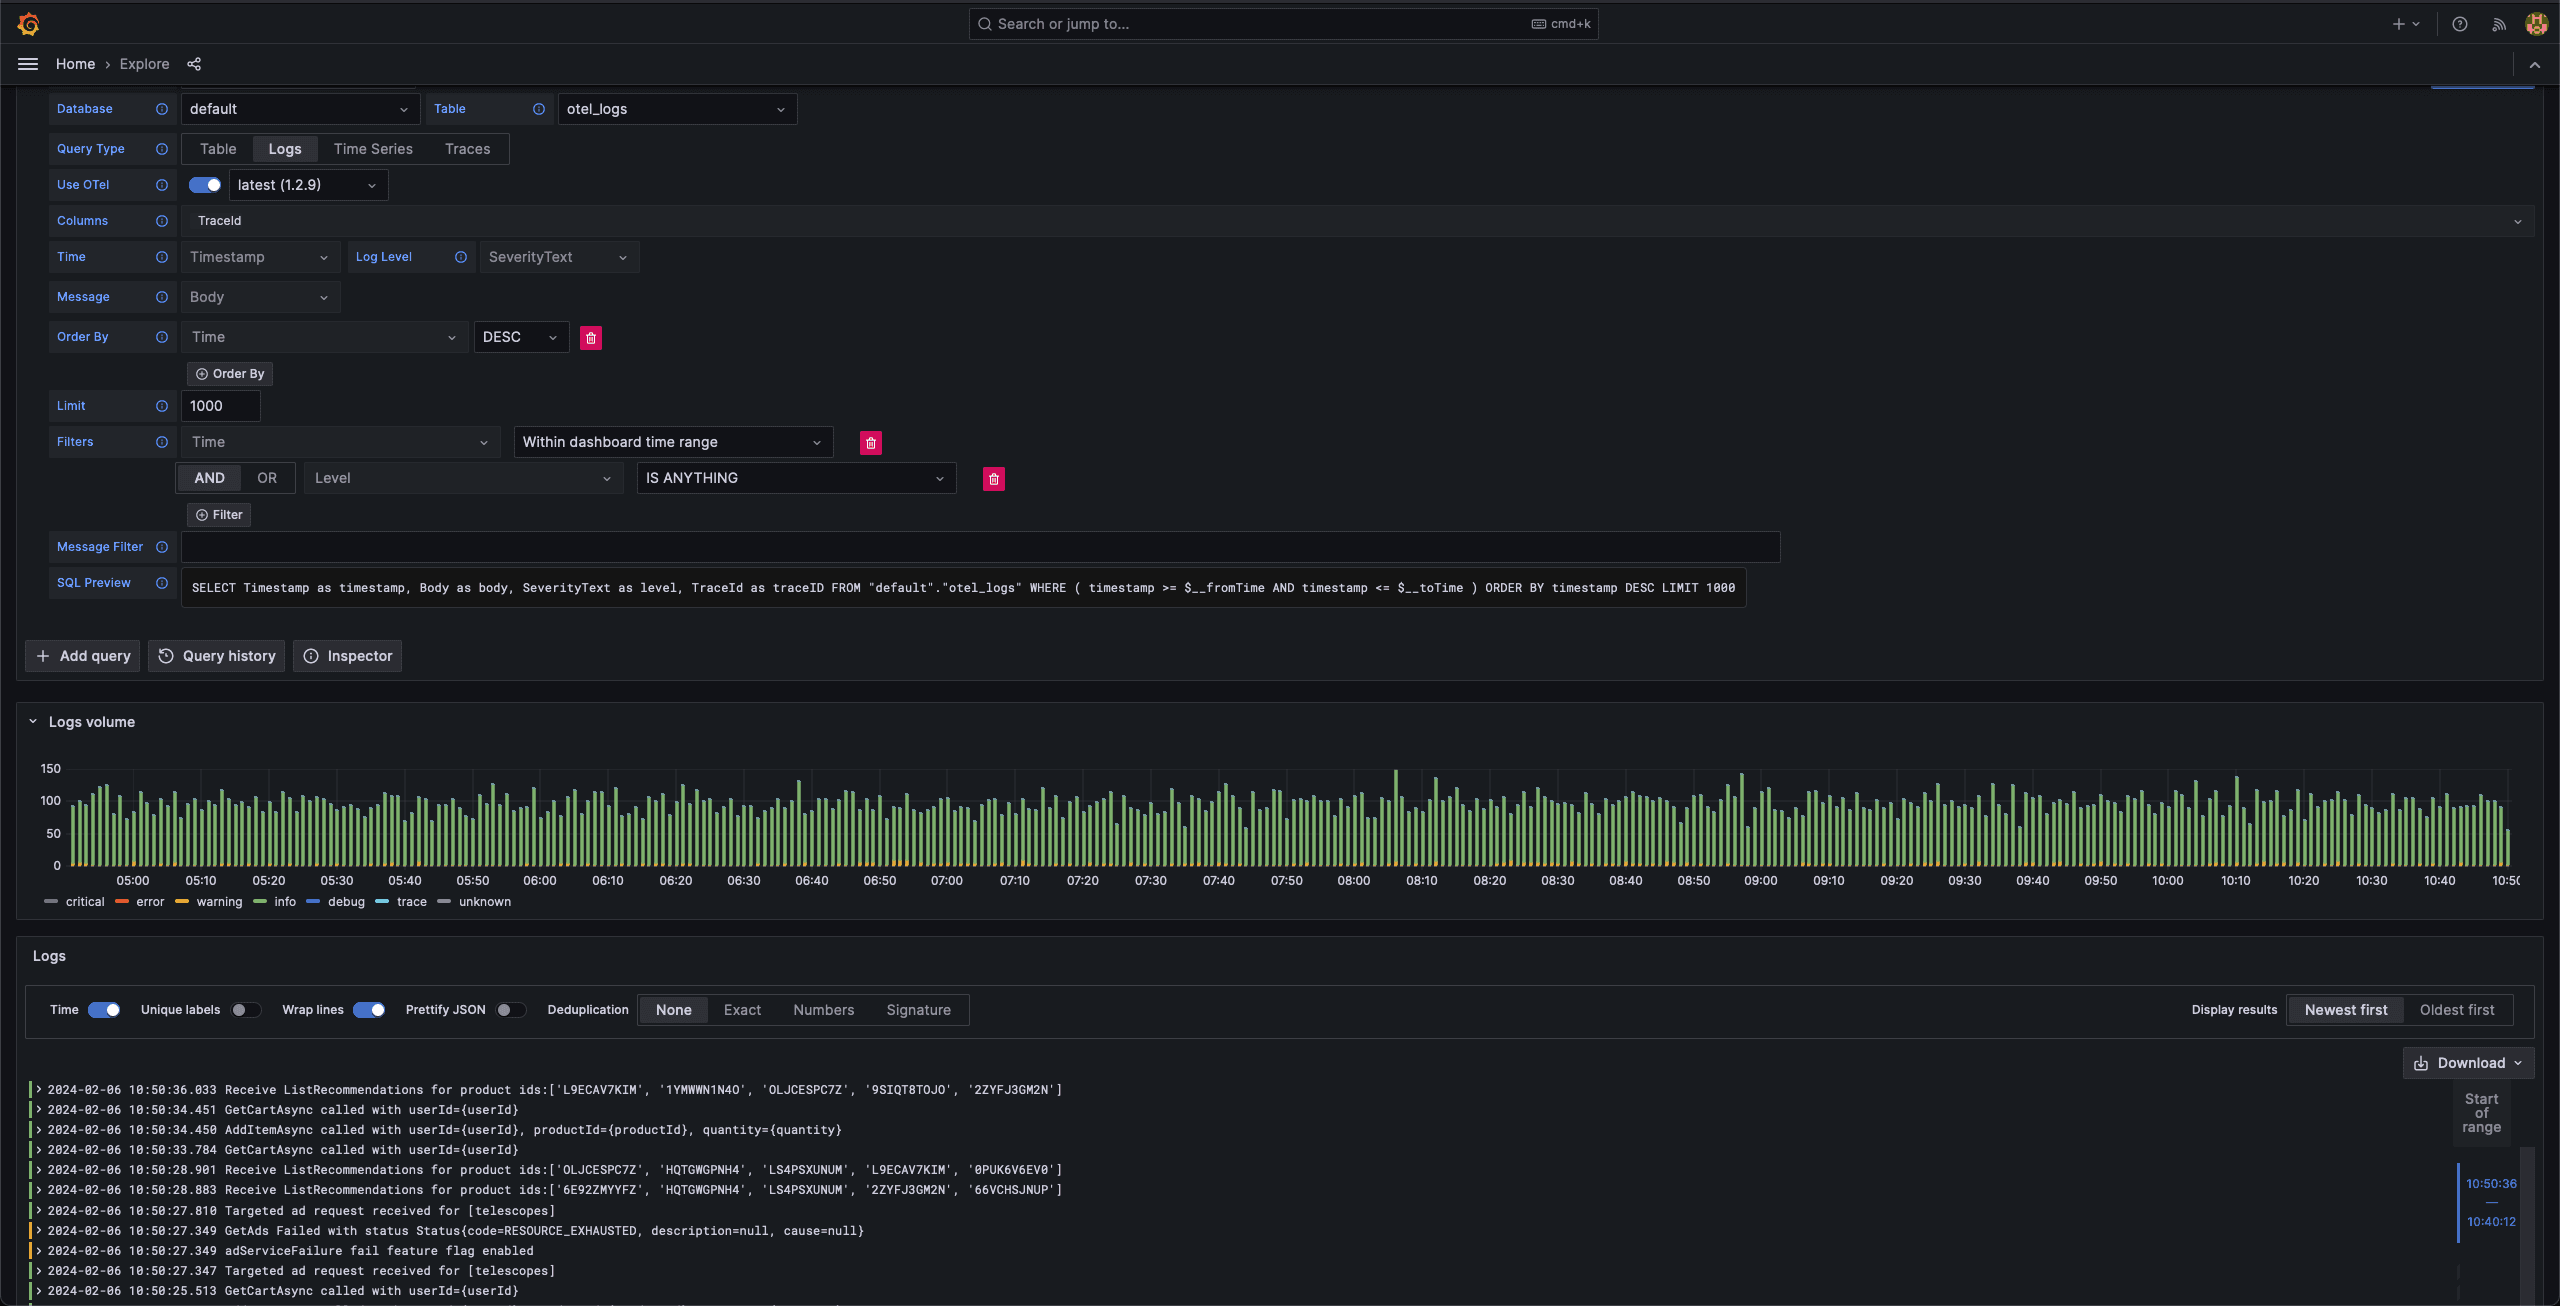
As you can see we also now get a histogram showing the log levels over time. Thanks to now having the required information about the level and time field in the schema, we can automatically issue the required GROUP BY query to power this visualization.
Users can optionally apply filters to these results, modify the sort order or limit the number of results. All without writing SQL. For those looking to delve deeper, the SQL query is presented for editing via the classic editor.
Similar to trace, logs aren’t consumed in isolation when debugging issues, with users interested in the trace associated with the request that generated a log line. This is now supported with any traces extracted from logs and exposed as a clickable link. This causes the same split view demonstrated earlier when searching for traces and clicking on a traceid.
Alternatively, users can filter to only the other log lines related to a specific trace via the "View trace logs" button.
Other data types
While the above significantly simplifies the querying of logs and traces, users still need the ability to query time series data and build dashboards! As mentioned, this is supported through either selecting TimeSeries or Table for the Query Type causing an appropriate builder to be presented.
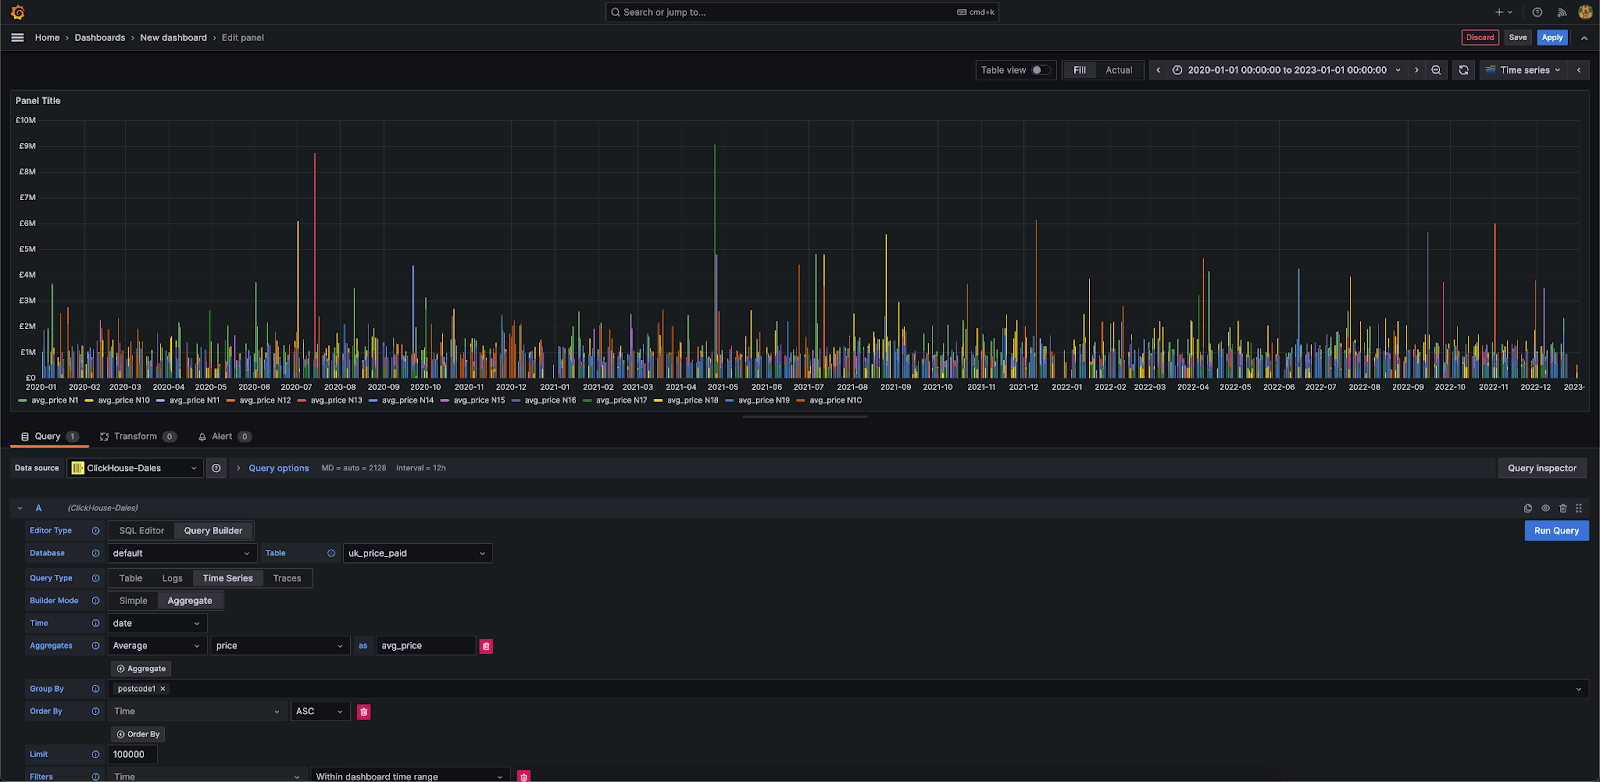
The TimeSeries builder provides a simple builder designed to aggregate data over time. Users can either select a “Simple” mode, which performs a straightforward retrieval of rows in time order for rendering, or perform an aggregation over time that allows computing metrics using any of ClickHouse’s analytical functions. In both cases a time field must be specified, which defaults to the first detected time field. A series column can be specified in either mode which results in a multi-line being rendered automatically. Below we show the UK house price average between 2020 and 2023 in North London.
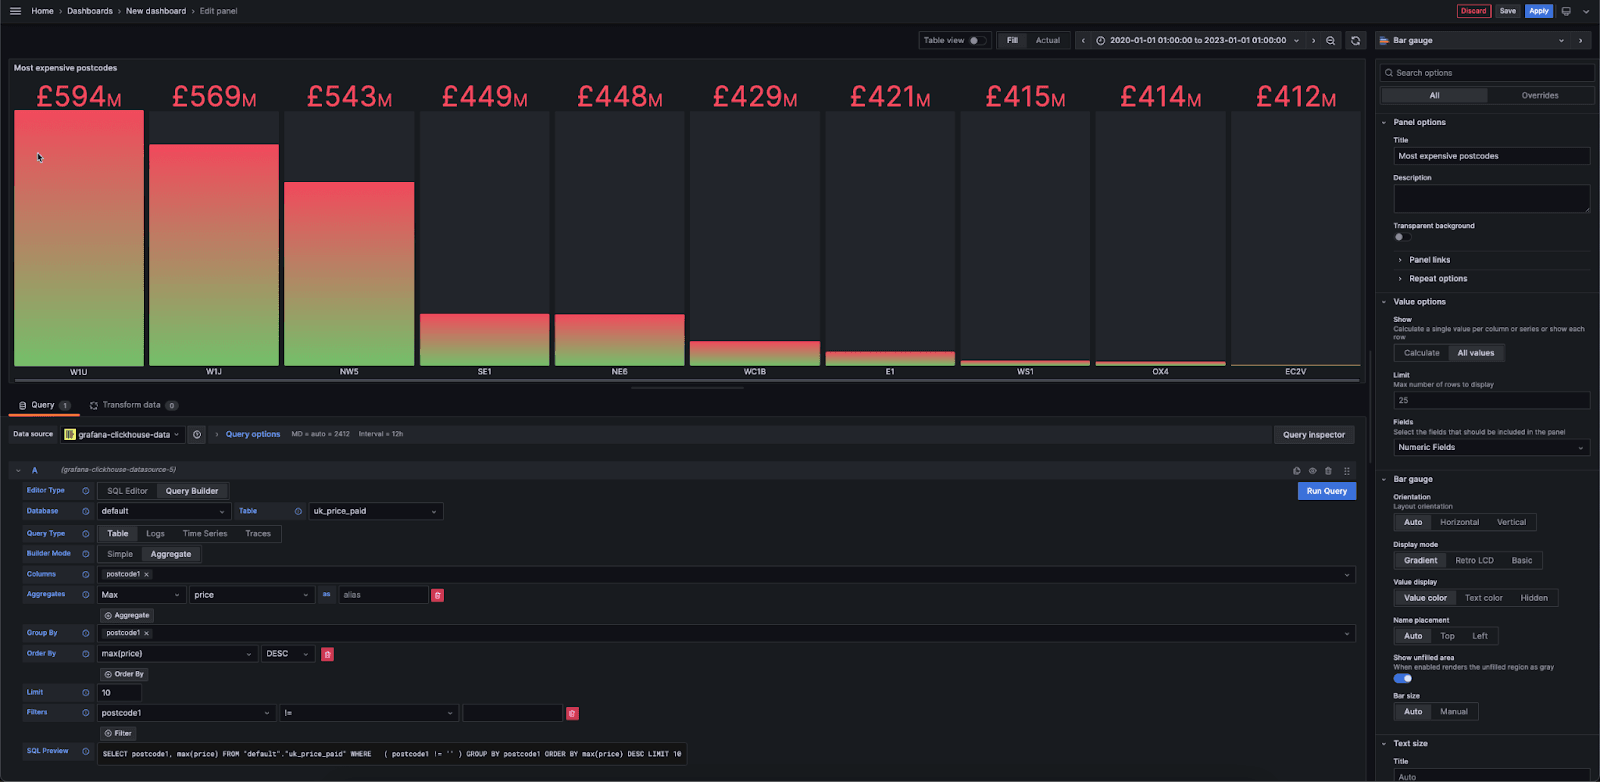
The Table builder can be considered the first “escape hatch” if you’re not querying time series, logs or traces. Typically this means you’re looking to plot bar charts, tables or single metrics. Below we use the house price data again to show the 10 top postcodes in the UK as a bar gauge.
And remember, you always have classic SQL if none of the above works..or maybe, like us, you just love SQL! Finally, all of these new features can be assembled as panels in Grafana dashboards.
Looking forward
An Observability user will have noticed the above omits an important component of the use case: Metrics. As discussed in our blog post, Metrics is the least mature of the 3 pillars for SQL-based Observability. Principally this is because ClickHouse lacks a Prometheus ingestion interface and means of querying in PromQL with functions such as rate ... .for now :) Any builder for this pillar felt like it would offer an inferior solution to addressing the problem properly. Stay tuned for updates!
We see a number of other opportunities to enhance the plugin over the coming months. The live tailing of logs is a feature we are aware many users need to diagnose issues in real- time. Additionally, we're excited about the potential integration of AI services into the plugin. Building on the success we've seen with AI-powered SQL query assistance in our Cloud console, we are now exploring the possibility of incorporating the same capability into the plugin with the aim of allowing users to query their logs and traces with natural language.
We should emphasize that the current plugin is in Beta. This is principally to garner feedback given how significant the change is. As our users, and community, your voice matters and we’d like to hear if these changes make sense and what else you’d like to see.
Conclusion
In this post we’ve explored how the new ClickHouse Grafana plugin places Observability front and center of its new design philosophy and how this greatly simplifies the querying of logs and traces, while retaining the flexibility to query other data types such as time series.