We're excited to introduce Petr Janda, the founder of Synq who recently spoke at the ClickHouse Meetup in London on May 25th, 2023. In his talk, Petr delved into the process of building user-facing and internal applications with ClickHouse.
Now, as a guest contributor, Petr extends on his talk in this comprehensive blog post. Read how his team at Synq built a unified data platform with ClickHouse, skillfully merging operational and analytical needs.
Data powers every software system.
Its complexity, variety, dramatically increasing volumes, and demanding use cases spawned the development of specialized data systems—some focused on low latency operational use cases, others on analytical queries spanning large-scale datasets. As a result, technology stacks often split into analytical and operational systems that develop separately.
Analytical systems have evolved rapidly in the last decade—from Hadoop to cloud products like Redshift and later Snowflake or BigQuery. But despite their ability to elastically scale and process nearly unlimited amounts of data (as long as you have enough dollars to pay the bill), they were not designed for typical operational use cases with low latency requirements.
But does it have to be this way? What would our systems look like if we built both operational and analytical use cases around a unified data platform?
We thought hard about these questions as we started Synq a year ago. Fast forward to today, we power our entire user-facing application, our internal analytics, data reliability monitoring alerts, in-application analytics, and machine learning models that train on a continuous stream of data from a single data platform—ClickHouse.
Finding the Right Platform
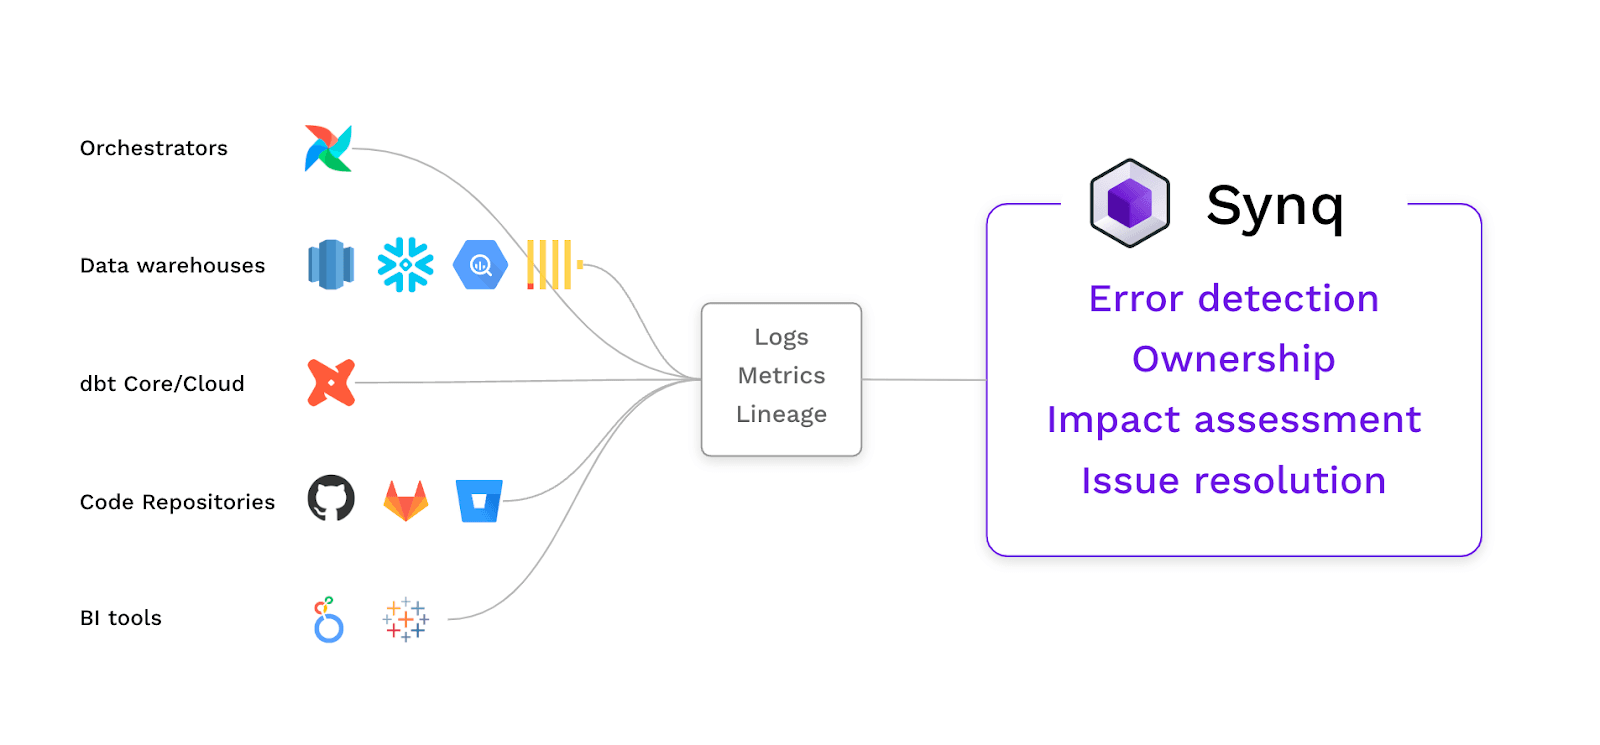
Synq is a data observability platform that analyzes log-level data from complex data ecosystems. At its core, it is a large-scale log processing engine that ingests and processes data from dozens of systems. Data arrives as a continuous stream of events, with frequent bursts of volume when our customers run large batch processing jobs or as we backfill data for newly onboarded customers in minutes.
We’ve identified three critical criteria for the selection of the tool:
- To power excellent user experience, we set ambitious performance goals for backfilling data: We want to provide value to our customers immediately as they onboard our product. The scalable ingest performance that can easily handle tens of thousands of operations per second was crucial. We wanted to hit the limit of how fast we could pull the data from external systems rather than being limited by the speed of our internal storage.
- We wanted an infrastructure that would serve our first set of defined use cases and provide functionality to support new use cases quickly. The ideal platform would let us create various transformations of raw log-level data that could be queried efficiently.
- Finally, we had the ambition to build a single platform that could store our raw log data and, at the same time, act as a serving layer for most data use cases needed by our applications and APIs, limiting the need for ETL data around to specialized storage systems. We’ve set an ambitious goal for our application performance and therefore needed an underlying data platform to comfortably serve our end-user-facing applications with sub-second latencies in low hundreds of milliseconds.
We had a demanding combination of requirements—elastic ingest performance, flexible internal transformations, and support for low latency queries.
As we started building the core of our system, we began with Postgres with a time series plugin. It was sufficient to support our initial development, but we knew we would outgrow it. The decision point to look for a new platform came after seeing suboptimal performance for large backfill jobs. After running tests on various platforms, including leading data warehouse providers, we could frequently hit two of the above requirements but only some of the three.
Until we found ClickHouse.
It took a few days of testing to realize it was a perfect match. Even with small clusters, we could ingest tens of thousands of rows per second; we quickly put ClickHouse Materialised Views to use to create query-specific data models and saw query latencies in hundreds of milliseconds which checked all three requirements. In all our tests ClickHouse maintained consistent read query performance under heavy ingest load.
To focus our entire development team on the R&D of our platform, we partnered with ClickHouse Cloud. We were, from the beginning, impressed by the stability. Our ClickHouse platform always reliably served application queries, even under immense pressure.
Building the Basics
The first challenge was to build a solid ingestion. Our system is written in Go, and we chose the officially maintained Go client clickhouse-go. Our ingestion microservice consumes data from a durable queue and pushes data to ClickHouse as it arrives. We quickly realized that without extra treatment, this was a naive approach. Our system would frequently insert thousands of requests with just a handful of rows, which is not optimal for ingesting data to ClickHouse. As a result, we saw the number of parts in our tables exploding as the ClickHouse engine couldn’t merge them fast enough. The cluster started to protect itself by timing out our inserts.
We had to evolve our approach.
Due to traffic which can spike, we wanted to avoid buffering any events in our system. It would cause large memory spikes and potential OOM errors under heavy load, so buffering in application code wasn’t an option.
Initially, we tried to leverage the ClickHouse Buffered table engine. The in-memory buffer in front of the landing table within the cluster solves the small parts problem. The downside is that it allocates considerable memory in our cluster.
After consultation with the ClickHouse team, we’ve settled on the final approach—Async Inserts. Async API works without buffered tables. From the client’s perspective, the buffering mechanism is transparent, entirely managed by ClickHouse.
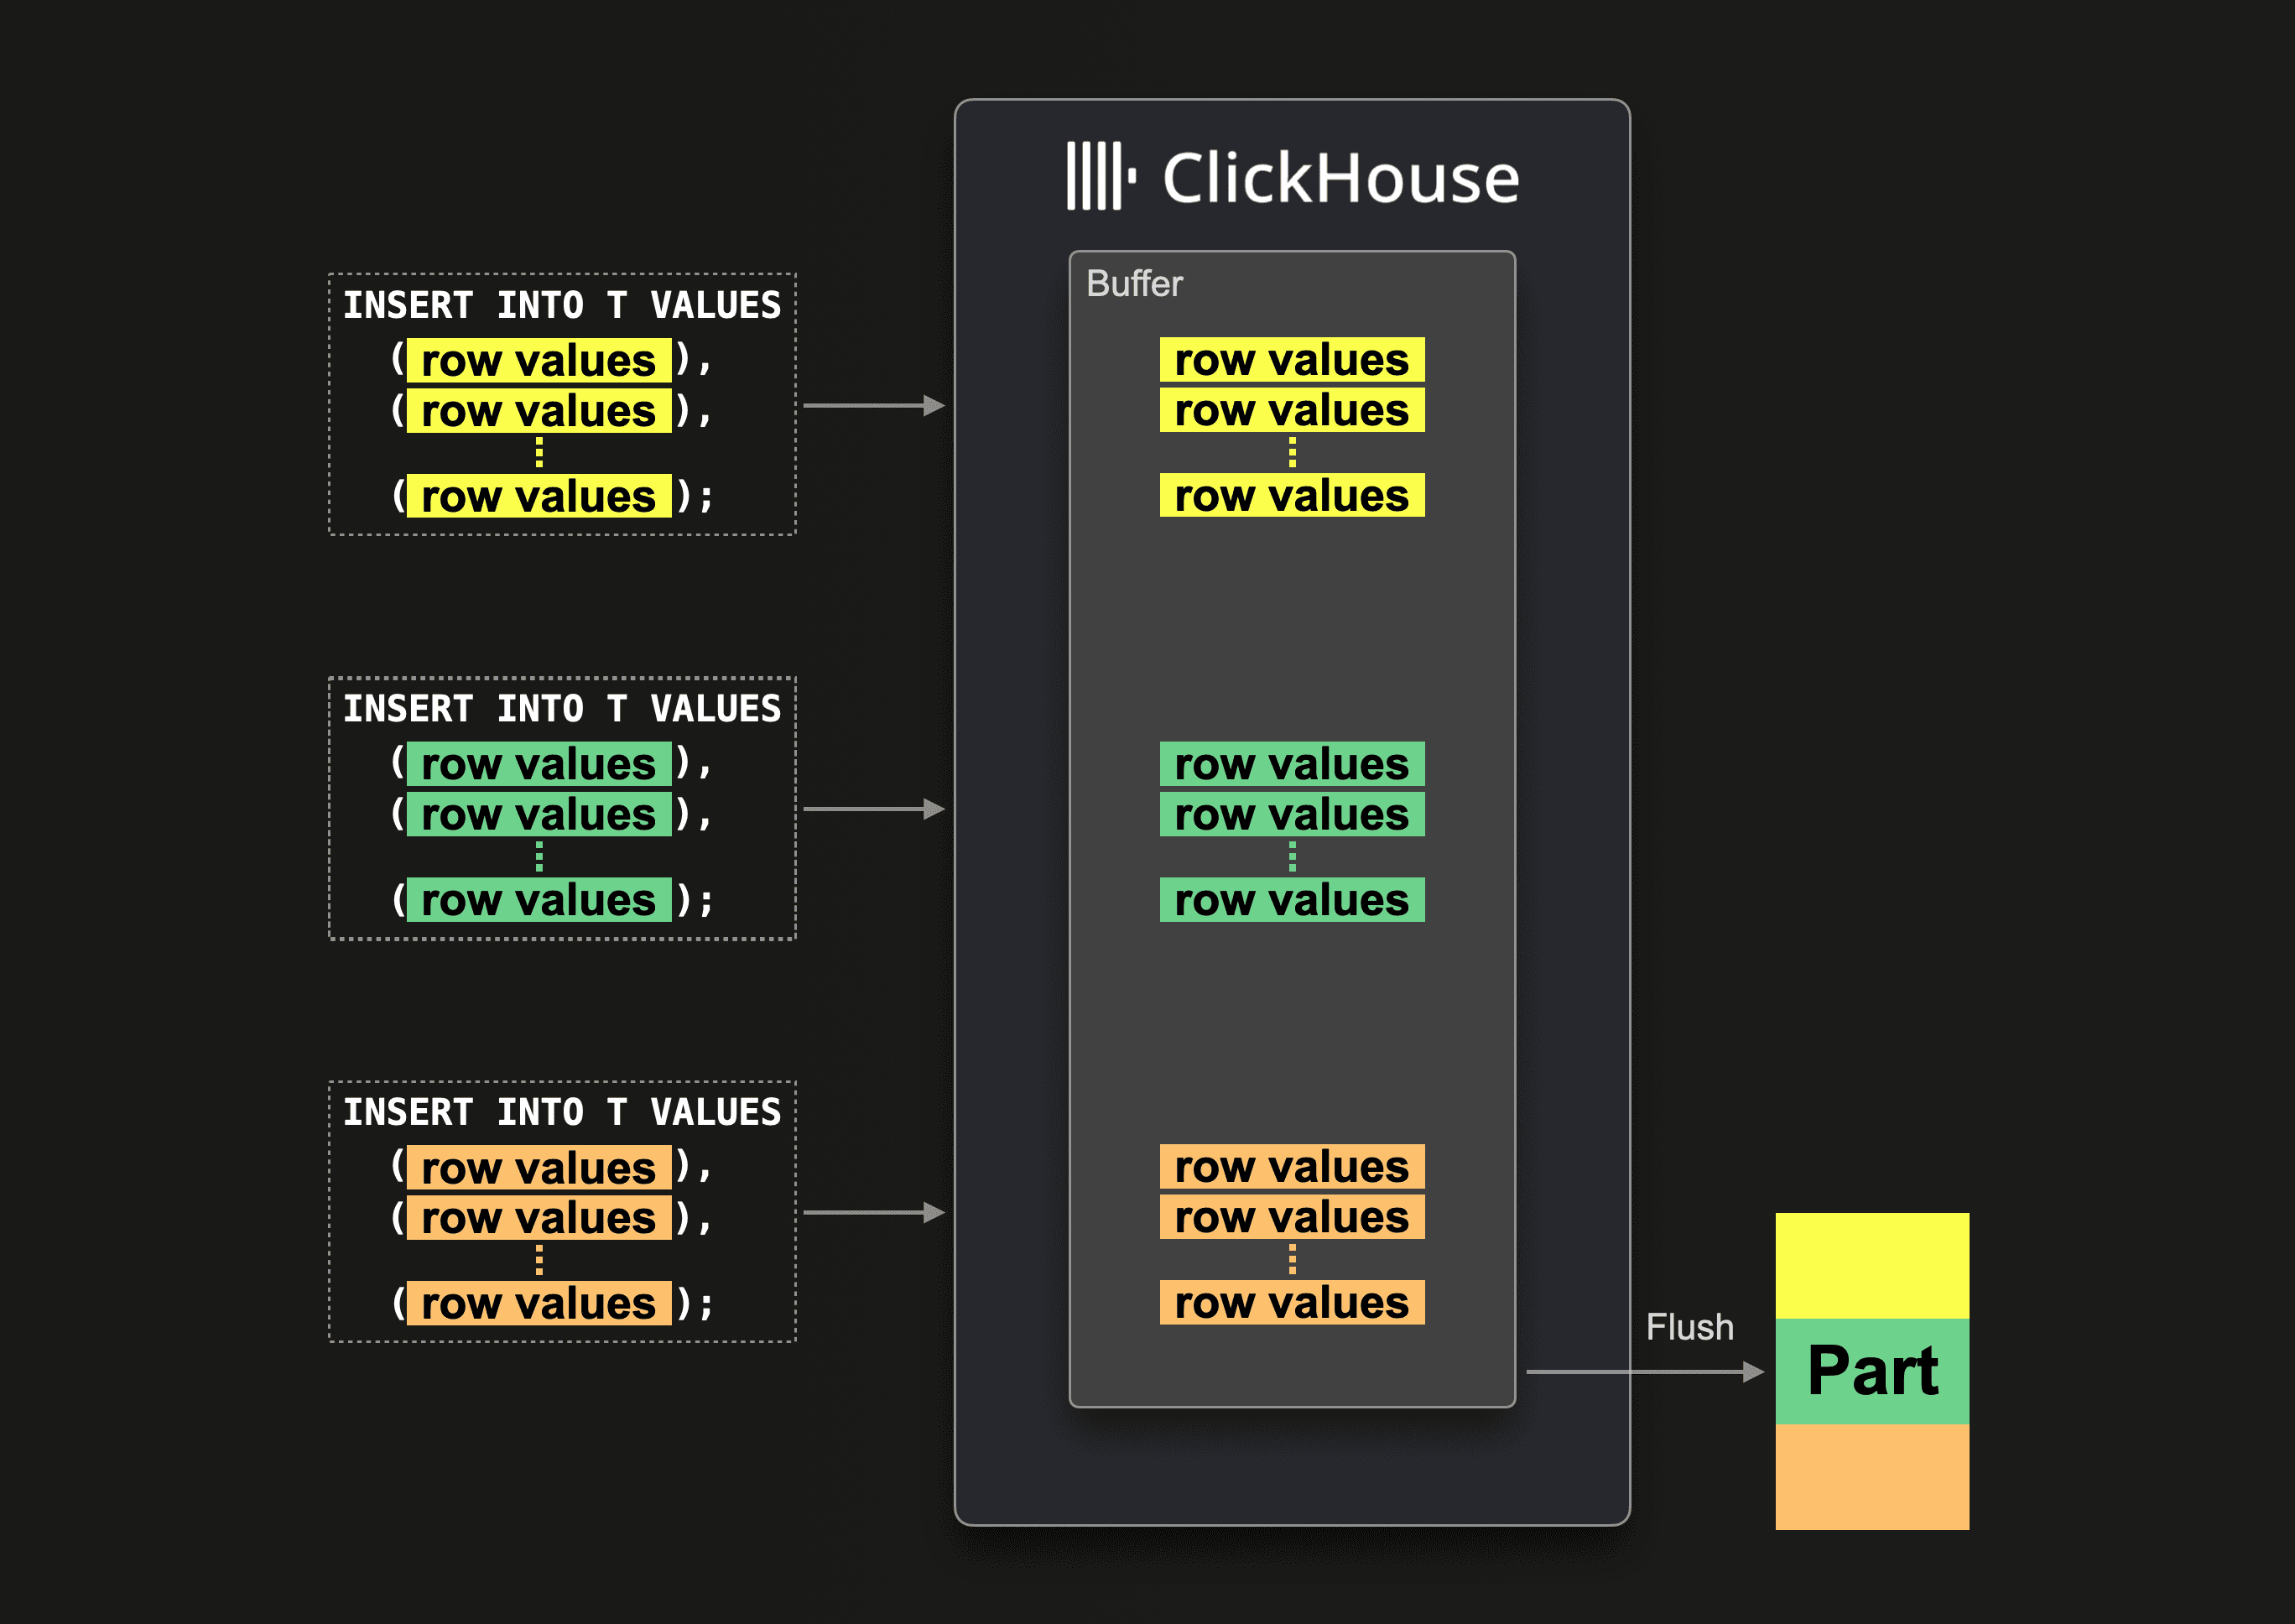
The small inserts are grouped on the cluster and flushed to the table when the insert reaches a certain number of total rows or once every few seconds.
Additionally, if the insert fails, we don’t acknowledge messages in the queue, which will eventually retry, making our system resilient to potential failure modes in ClickHouse ingest.
But this left us with one more challenge.
Due to potentially repeated partially successful inserts or because our queues don’t guarantee exactly one delivery, we need to handle duplicate events.
As a solution, we leverage the ReplacingMergeTree table engine that prunes duplicates as table parts merge and further add LIMIT 1 BY clause with the surrogate key of log records in our queries to account for duplicate records that are in the table before their deletion by merging operations which happens asynchronously in the background.
With reliable and scalable ingestion in place, we could leverage another critical component of our cluster: Materialised Views.
Optimising for Performance
Our application is designed around small and composable API calls, which gives us a lot of flexibility to build new experiences on top of common infrastructure without constantly changing APIs. Many of which are hitting ClickHouse.
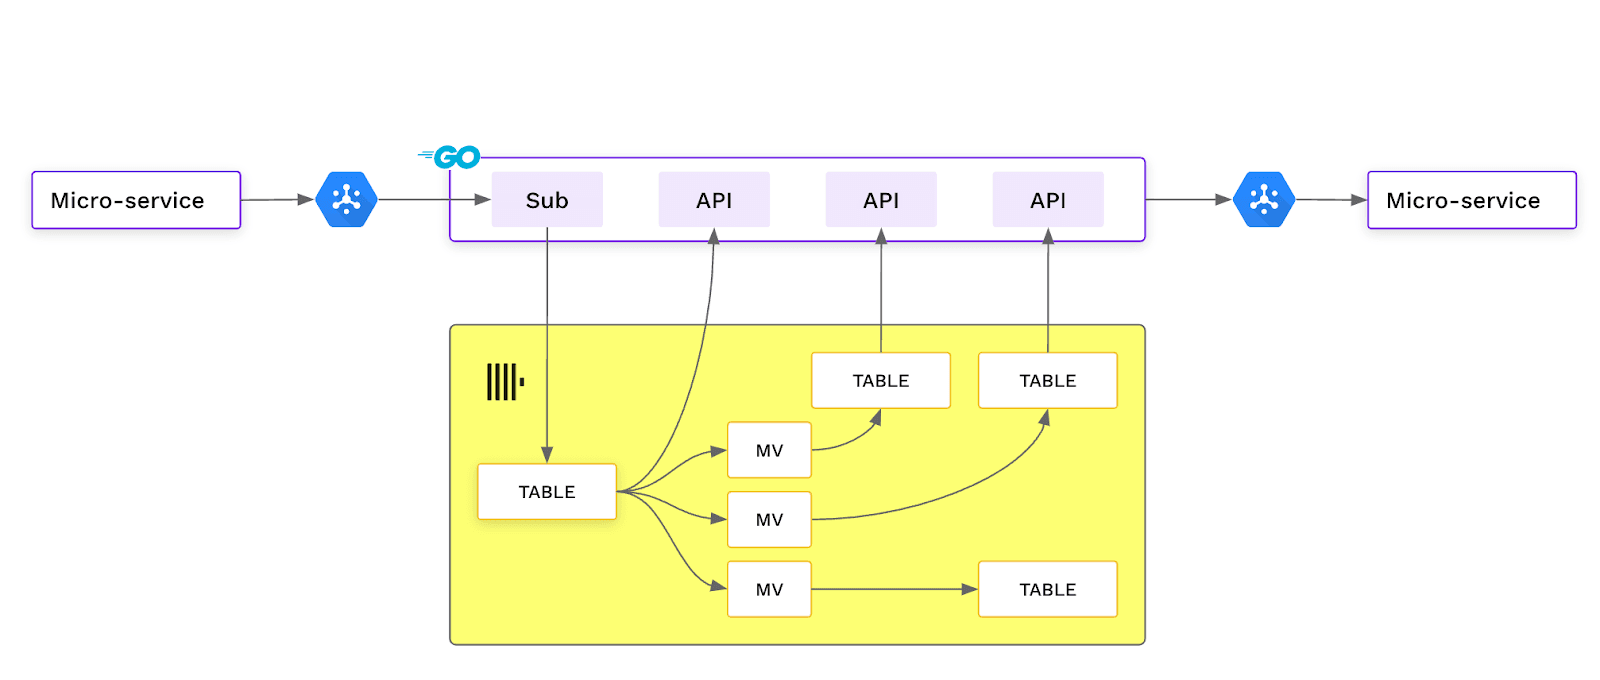 Micro-service consuming data from pubsub streaming it into a table in ClickHouse, supported by materialised views that create specialised data tables that power low latency APIs.
To maximize performance, we’ve created specialized tables that transform our raw logs data to a format optimized for our queries, supported by adequate partitioning and ordering keys to optimize the layout of the data on disk.
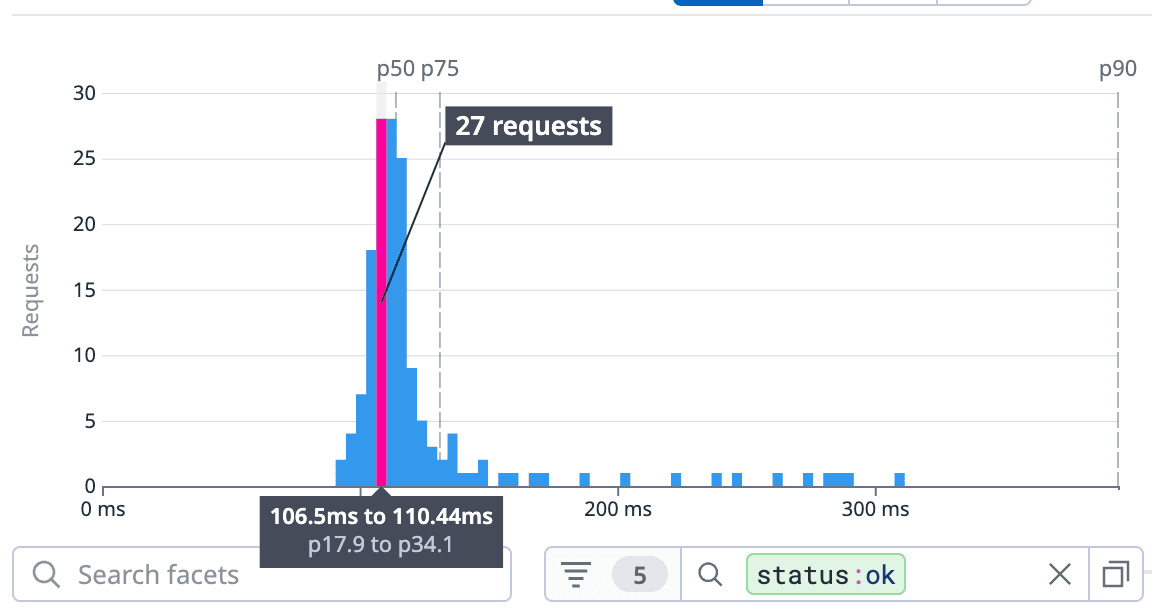
We’ve learned that choosing appropriate ORDER BY clauses for tables aligned with our query patterns was vital to minimizing the amount of data scanned per query. After appropriately setting ORDER BY clauses on top of pre-calculated tables powered by Materialised Views, we can fine-tune even complex analytical queries down to <100ms milliseconds latency.
These low-level data layout optimizations are essential to ClickHouse query performance, as with tuned layout, we have seen an order of magnitude drop of data that has to be scanned to respond to our queries. These tables often work with latencies around 100ms.
Data between raw logs and specialized tables are kept in sync in real-time by materialized views. With the flexibility of materialized views and low-level table controls, performance optimizations are cheap to test. We could do more of them fast and, as a result, converge on optimized solutions.
Data Warehousing Use Cases with dbt
As we onboarded more customers and expanded the third-party systems we collected data from, we noticed new errors in our data.
Due to misconfigurations or various incidents across source tools, we have seen more cases when our customer’s systems didn’t always provide 100% accurate input data. We’ve identified the need to enhance testing of completeness, timeliness, and correctness of data we ingest on behalf of our customers.
We’ve decided to use the popular data transformation framework dbt and create auditing tables that extract summary statistics about our log data.
With the addition of dbt, we’ve changed our ClickHouse usage patterns. We’ve complemented real-time table synchronization with tables created as SELECT statements from other tables, which feels close to more traditional data warehousing. With dbt execution orchestrated in various intervals, we can also leverage ClickHouse for internal BI use cases. We’ve found this setup very practical, as we can flexibly create new analytical views of our customer data without moving it from our production operational systems.
In-app Analytics
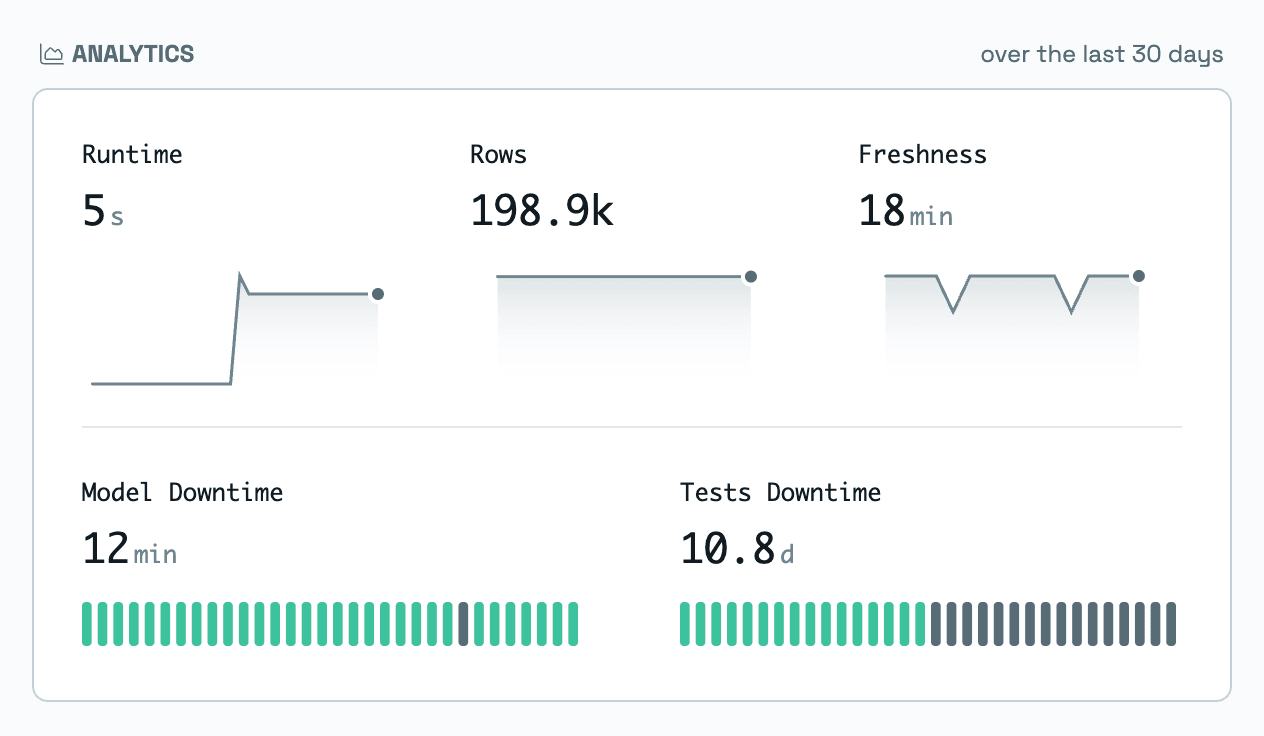
With all customer data in one place, using our ClickHouse cluster as a backbone for many other use cases was natural. Our customers wanted to understand how their systems work at a higher level. They want to analyze the uptime of models and the frequency of errors, to reason about investments in data quality. Or understand the speed and cost of their models to maximize the value of their data infrastructure dollar investments.
All necessary observability, runtime, and quality metrics can be calculated from our log data. It’s also a perfect use case for a combination of ClickHouse and dbt.
To power our analytics views, we settled on a design with a dozen tables, each precalculating metrics for a particular set of use cases with predefined minimal time granularity to segment data. Our customers typically want to analyze trends in metrics monthly. We’ve decided to aggregate data into days to show the inter-month trends.
We have composed a few layers of logic: We included additional materialized views to parse out metadata from JSON objects in raw logs. With raw data extracted, we then aggregate log-level events into daily buckets, drastically reducing the tables’ size. Each UI query needs several thousands of rows tightly co-located in the underlying storage. This is due to optimizations we’ve done with table ORDER KEYs. The typical query has to scan very little data from the disk. We consistently observe latency around ~100ms on the API endpoint level, where each API calls queries at least five different metrics, which are part of the overall UI and is very snappy.
Our in-app analytics is as fast as any other application part, mainly thanks to optimized ClickHouse tables.
Conclusion
We've achieved a lot not even a year into our journey with ClickHouse. Our ClickHouse cluster needed tuning, but that is also its power.
With the ability to control underlying storage engines, ingest mechanics, or query settings, we have extreme control over our storage, which so far handled any use case we had in mind with performance that can support interactive user-facing experiences. Materialized views and integration with dbt give us a lot of flexibility to quickly develop new data use cases without any extra ETL code or large migrations. Tables optimized for new use cases can be created with DDL SQL and backfilled with a single SELECT statement. This makes development extremely efficient.
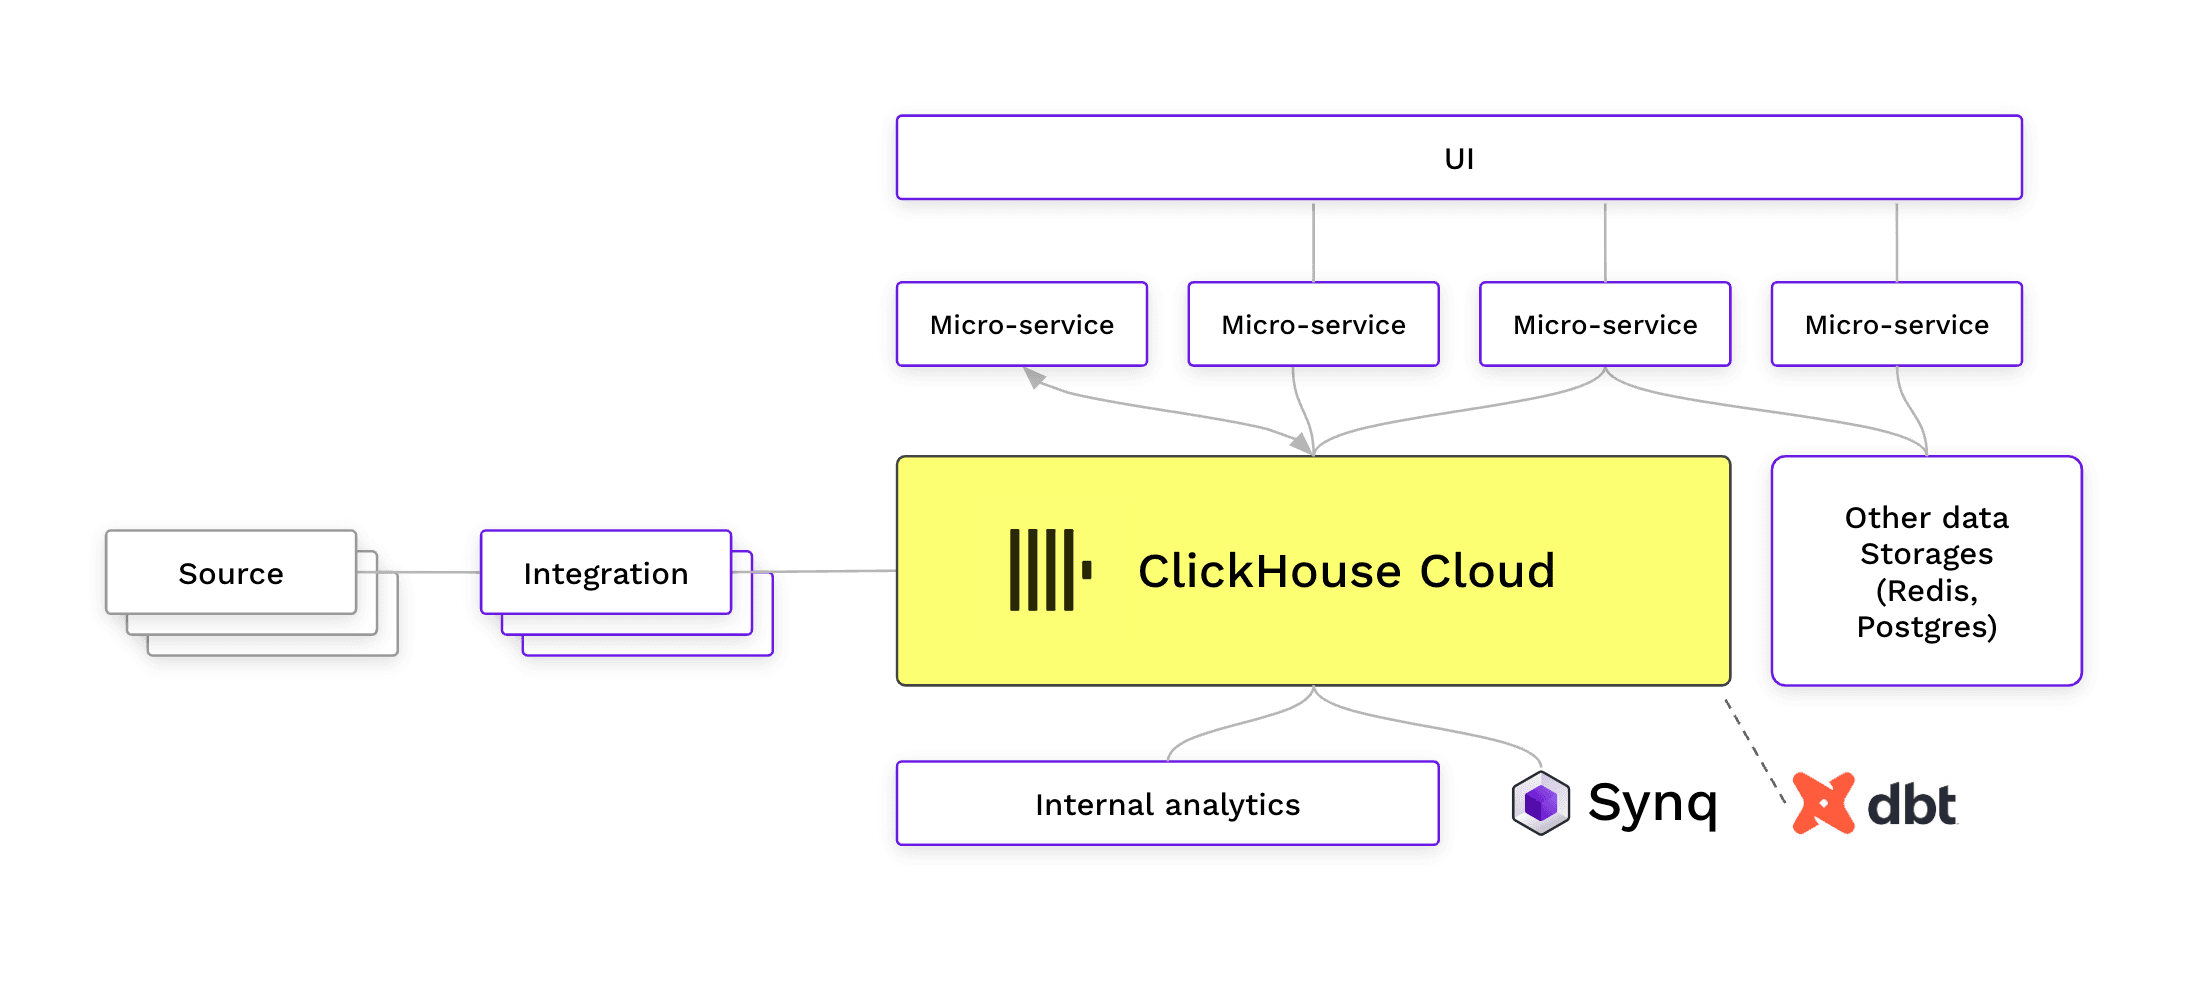 ClickHouse Cloud as a data platform supporting internal analytics, user facing analytics and entire customer facing applications.
On a conceptual level, we’ve fully merged our operations and analytics storage. We can think about our system in terms of use cases, knowing that we have a performant data platform and other necessary building blocks to support them.
I am excited about this mindset of building modern cloud systems where analytics and operations are wholly integrated, especially in the context of the growing importance of data in nearly every business. Analytical data is becoming part of business-critical processes and dramatically benefits from staying close to operational systems. The storage systems like ClickHouse make building such systems possible.
About Synq
Synq is a data observability platform helping teams at companies such as Typeform, Instabee, and LendInvest monitor their cloud data stacks. Being built on top of ClickHouse, it provides deep integration into ClickHouse clusters with capabilities to detect delayed data loads and uncover hidden data anomalies, complemented by automatically created data lineage and tooling for managing data quality.
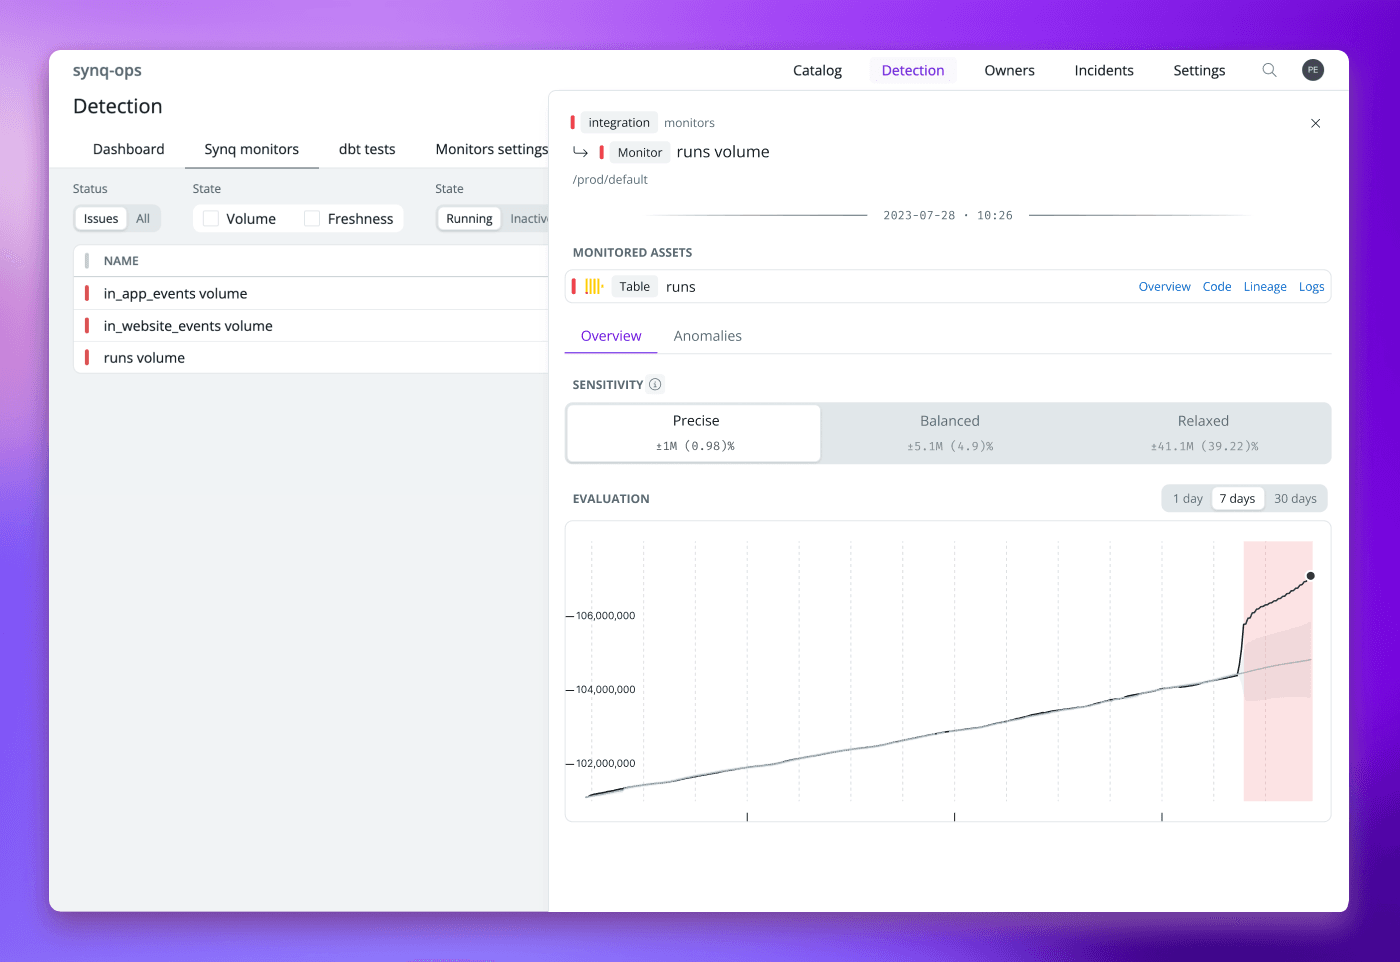 Example data anomaly detected by Synq, where the volume of data in a table started to grow abnormally due to a fault in a system upstream.
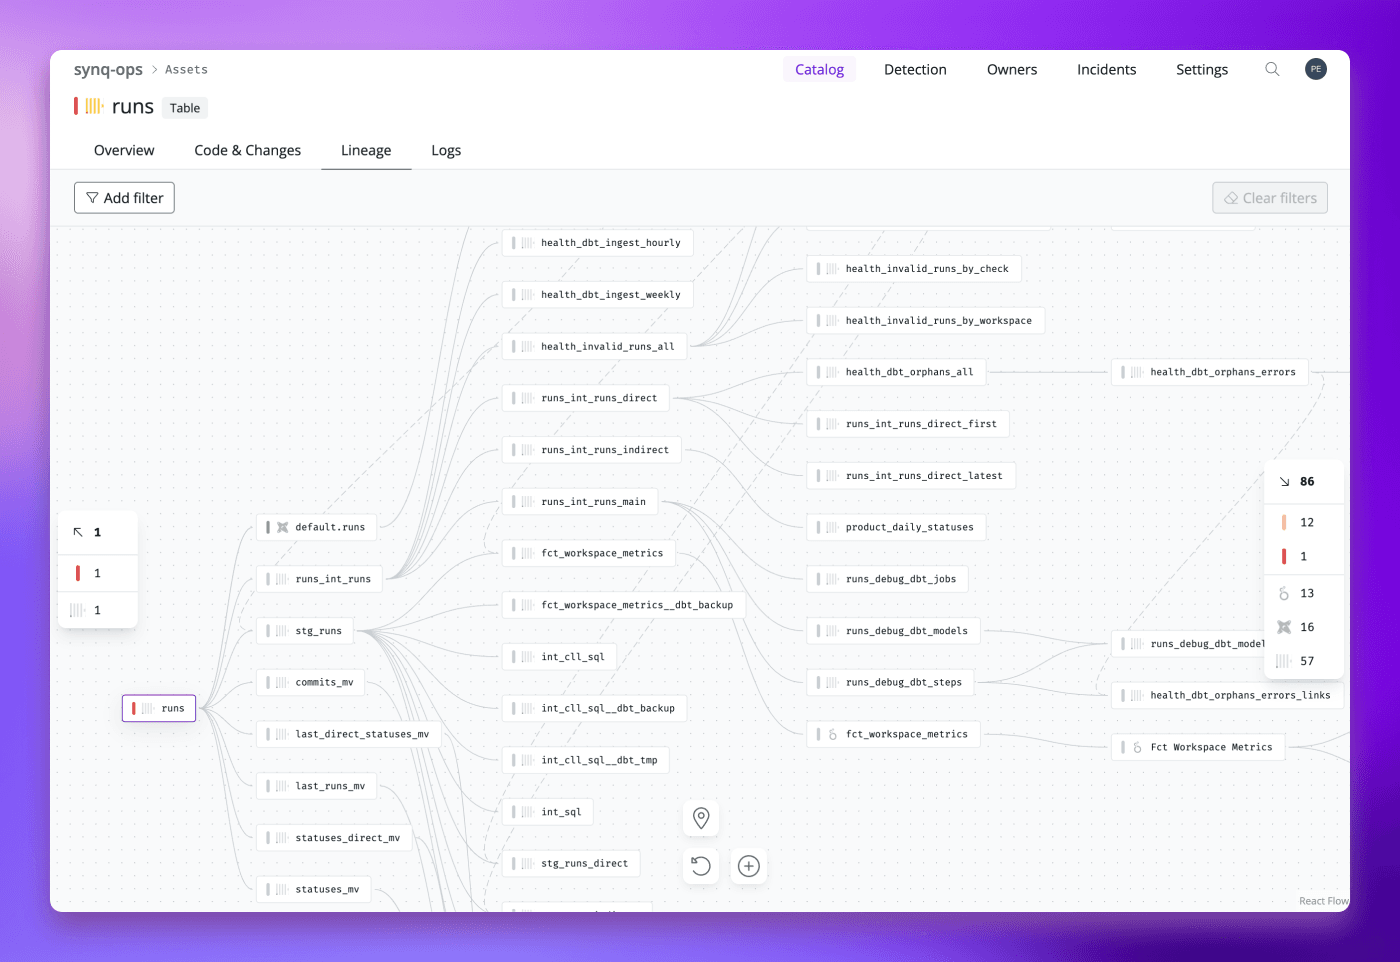 Example data lineage extracted by parsing SQL definitions of tables, views and materialised views from ClickHouse, providing an overview of structure of data flows inside of a ClickHouse cluster.
More Details
- This talk was given at the ClickHouse Meetup in London on May 25, 2023
- The presentation materials are available on GitHub
- Learn More: https://www.synq.io/